Bollinger Band + RSI Trading Strategy That Actually Works
Summary
TLDRThis video introduces a Bollinger Bands and RSI-based trading strategy with a high success rate. The presenter guides viewers on setting up Bollinger Bands with a 30-period moving average and 2 standard deviations, and RSI with a 13-period length and threshold values of 70 and 30. The strategy capitalizes on mean reversion, entering trades when price extremes coincide with RSI extremes. A crucial tip is to avoid trading during sideways market movements, and the video also covers the concept of divergence for more accurate trade entries. The presenter encourages viewers to like the video and check out another video on a MACD strategy with an impressive win rate.
Takeaways
- 📈 The video introduces a trading strategy using Bollinger Bands and RSI with a high success rate when used correctly.
- 🛠️ To set up Bollinger Bands, change the length to 30 and the standard deviation to 2, and customize the appearance as desired.
- 🔢 The central line of the Bollinger Bands is a moving average calculated over the specified length of 30 candlesticks.
- 📉 The lower and upper lines of the Bollinger Bands represent standard deviations, indicating price volatility.
- 🔄 RSI (Relative Strength Index) is added to the strategy, with settings adjusted to an upper threshold of 70 and a lower threshold of 30, and a length of 13.
- ⚠️ RSI helps identify overbought (above 70) and oversold (below 30) conditions in the market.
- 🔄 The strategy is based on the concept of mean reversion, expecting prices to return to the moving average after significant movements.
- 🚫 To avoid false signals, only enter trades when the price touches the Bollinger Bands and RSI hits extreme values (below 25 for long trades, above 75 for short trades).
- 📊 The strategy may not work well in sideways markets, where prices do not exhibit clear trends.
- 📉 In sideways markets, be cautious of trades when Bollinger Bands are narrow and RSI is stable, as significant price movements may follow.
- 🔄 Divergence occurs when price makes a lower low but RSI makes a higher low, signaling a potential reversal and a good entry point for a trade.
- 👍 The presenter encourages liking the video and watching another video on a MACD strategy with an 86% win rate.
Q & A
What is the primary focus of the video?
-The video focuses on explaining a trading strategy that uses Bollinger Bands and RSI (Relative Strength Index) for identifying support and resistance levels and making profitable trades.
What is the default setting for Bollinger Bands in TradingView, and how does the video suggest changing it for this strategy?
-The default setting for Bollinger Bands in TradingView is a length of 20 with a standard deviation of 2. The video suggests changing the length to 30 and keeping the standard deviation at 2 for this specific strategy.
Why is the RSI indicator important in this trading strategy?
-The RSI indicator is important because it helps determine if a security is overbought or oversold, which is crucial for identifying potential entry and exit points in the trading strategy.
What are the modified settings for the RSI in this strategy?
-In this strategy, the upper band of the RSI should be set to 70, the lower band to 30, and the length to 13.
What is the concept of mean reversion, and how does it apply to this trading strategy?
-Mean reversion is the idea that prices and returns eventually move back towards the average or mean. In this strategy, it means that after a significant price movement, the price is expected to return to the moving average, which is the center line of the Bollinger Bands.
How does the strategy suggest entering a long trade?
-A long trade should be entered when the price moves below the lower Bollinger Band and the RSI goes below 25, indicating an oversold condition.
What conditions should be met to enter a short trade according to the strategy?
-A short trade should be entered when the price moves above the upper Bollinger Band and the RSI goes above 75, indicating an overbought condition.
What is the main issue with using this strategy in a sideways market?
-In a sideways market, where prices are not trending but rather moving in a narrow range, the strategy may not work well as it is harder to predict price movements, leading to potential losses.
What is divergence, and how does it relate to the trading strategy?
-Divergence occurs when the price makes a new low (or high) but the RSI makes a higher low (or lower high), indicating a potential reversal in the trend. In the strategy, this is a good sign to enter a trade, especially if the RSI was previously below 25.
What is the video's suggestion for avoiding losses when the market is moving sideways?
-The video suggests not trading during sideways markets when the Bollinger Bands are close together and the RSI is not hitting extreme values, as this can indicate an upcoming strong price movement in one direction.
What additional resource does the video recommend for viewers interested in trading strategies?
-The video recommends watching another video on a MACD strategy that claims to have an 86% win rate for trading.
Outlines

This section is available to paid users only. Please upgrade to access this part.
Upgrade NowMindmap

This section is available to paid users only. Please upgrade to access this part.
Upgrade NowKeywords

This section is available to paid users only. Please upgrade to access this part.
Upgrade NowHighlights

This section is available to paid users only. Please upgrade to access this part.
Upgrade NowTranscripts

This section is available to paid users only. Please upgrade to access this part.
Upgrade NowBrowse More Related Video

Powerful swing or scalp strategy tuned for minimal drawdown and consistent results!

[SUPER PATRON] para IQ OPTION 90% efectivo!
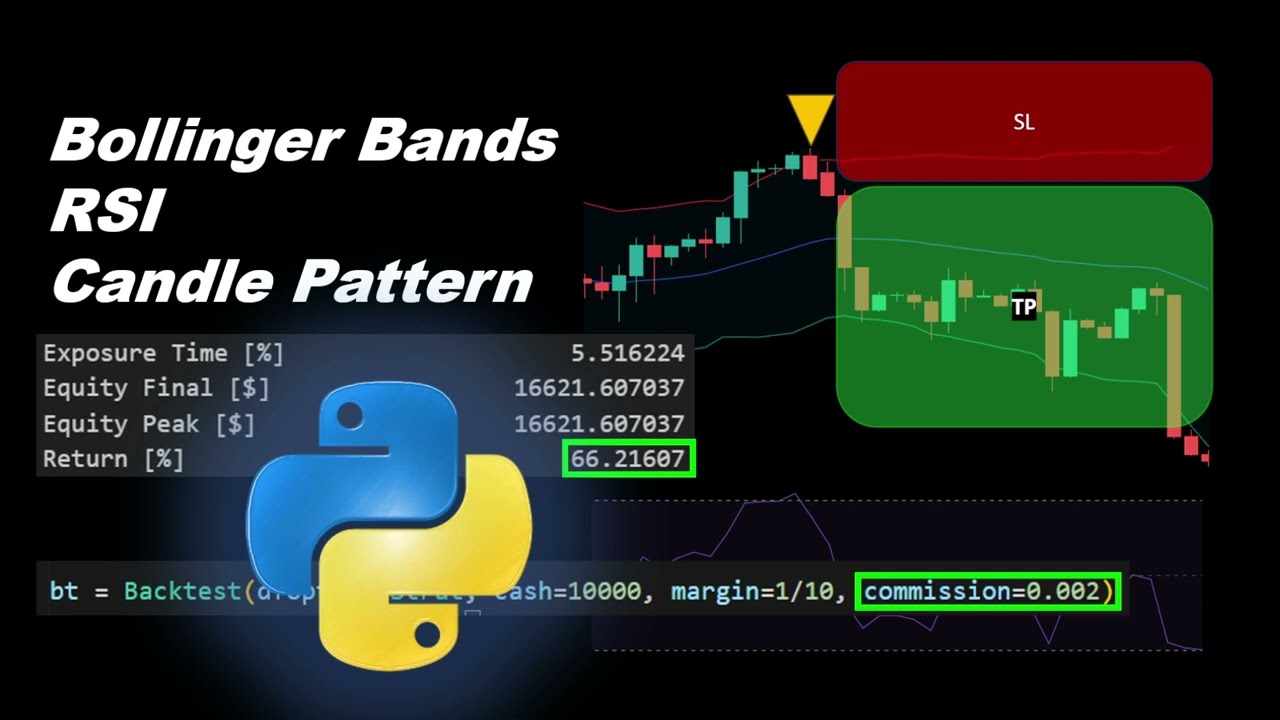
Profitable Strategy Using Bollinger Bands and RSI Automated in Python
SAFEX BROKER - FAZENDO MAIS DE R$2.100 REAIS UTILIZANDO RSI E BDB
How to Spot Trend Reversals Using Powerful Indicator Combination Part 2
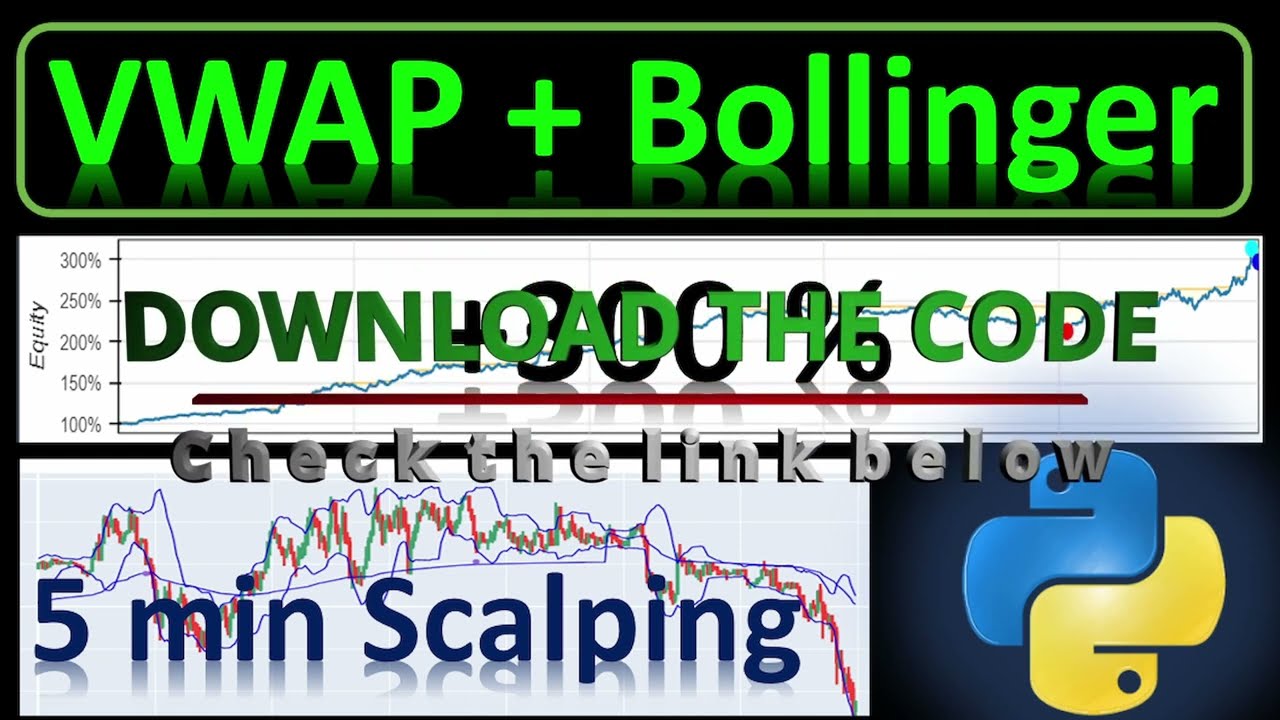
Python Backtest: Profitable Scalping Strategy with VWAP, Bollinger Bands and RSI Indicators
5.0 / 5 (0 votes)