Analisis Independent Sample t test dengan SPSS
Summary
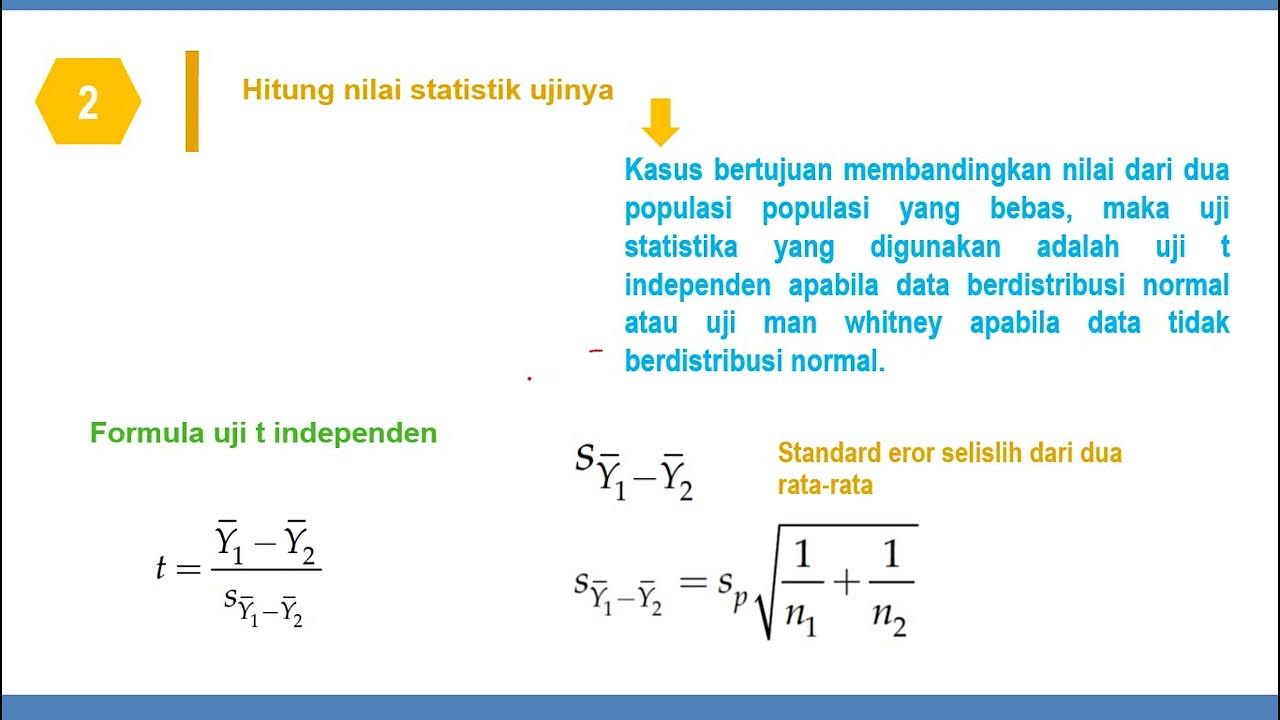
TLDRIn this tutorial, the process of conducting an independent sample t-test using SPSS is explained. The analysis focuses on comparing motivation scores between males and females, with motivation as the dependent variable and gender as the independent variable. The video covers the necessary steps to input data, perform the test, and interpret results. Key points include understanding the assumptions of normality and homogeneity of variance, and how to interpret the output, which reveals a significant difference in motivation between males and females. The tutorial is designed to help users confidently perform statistical analysis with SPSS.
Takeaways
- 😀 The tutorial explains how to conduct an independent sample t-test analysis using SPSS, with motivation as the dependent variable and gender as the independent variable.
- 😀 The dependent variable in the analysis is the motivation score, and the independent variable is gender, coded as 1 for females and 2 for males.
- 😀 The data for the analysis is available for download, and it is important that all variables, including gender, are represented numerically (i.e., 1 for female and 2 for male).
- 😀 The SPSS procedure to run the independent sample t-test involves selecting 'Compare Means' and then 'Independent Samples T-Test' from the menu.
- 😀 When setting up the analysis in SPSS, the gender variable is specified as the grouping variable, and motivation is set as the test variable.
- 😀 The output of the analysis includes two parts: Descriptive Statistics and the Independent Sample t-test results.
- 😀 Descriptive statistics provide the mean, standard deviation, and standard error for both groups (males and females), indicating that males have higher motivation scores on average.
- 😀 It’s essential to interpret the t-test results beyond the descriptive statistics, as differences might not be statistically significant without further testing.
- 😀 The independent sample t-test assumes normal distribution of data and equal variances (homogeneity) between groups, which can be tested using SPSS.
- 😀 If the significance value for the homogeneity test is greater than 0.05, it suggests that the assumption of equal variances is met and the analysis can proceed.
- 😀 The t-test result shows a statistically significant difference between males and females in motivation (p < 0.001), indicating that males have significantly higher motivation than females.
Q & A
What is the hypothesis being tested in the tutorial?
-The hypothesis being tested is whether there is a difference in motivation between males and females.
What statistical test is used in this analysis?
-The analysis uses an independent sample t-test to compare the motivation scores between males and females.
Why are the gender values coded as 1 and 2 in the dataset?
-In the dataset, gender is coded as 1 for female and 2 for male because SPSS requires numerical values for categorical variables in order to perform the analysis.
What are the key assumptions that need to be checked before performing an independent sample t-test?
-The key assumptions are normality of the data and homogeneity of variances between the two groups.
How is the assumption of homogeneity of variances tested in SPSS?
-In SPSS, the assumption of homogeneity of variances is tested through the 'Levene's Test for Equality of Variances'. If the significance value is greater than 0.05, the assumption is considered to be met.
What does a p-value less than 0.05 indicate in the context of the independent sample t-test?
-A p-value less than 0.05 indicates that the difference between the two groups (males and females) is statistically significant, meaning there is strong evidence to reject the null hypothesis.
What is the role of the descriptive statistics output in the t-test analysis?
-The descriptive statistics output provides the mean, standard deviation, and standard error for each group, which helps in understanding the basic characteristics of the data before performing the t-test.
What does the independent sample t-test output tell us if the significance value is less than 0.05?
-If the significance value is less than 0.05, it indicates that there is a statistically significant difference in motivation between males and females.
What is the practical conclusion based on the analysis result in the tutorial?
-The practical conclusion is that male participants have higher motivation scores than female participants, and the difference is statistically significant.
What should be done if the assumption of normality is not met for the data?
-If the assumption of normality is not met, a non-parametric test, such as the Mann-Whitney U test, should be considered as an alternative to the t-test.
Outlines

このセクションは有料ユーザー限定です。 アクセスするには、アップグレードをお願いします。
今すぐアップグレードMindmap

このセクションは有料ユーザー限定です。 アクセスするには、アップグレードをお願いします。
今すぐアップグレードKeywords

このセクションは有料ユーザー限定です。 アクセスするには、アップグレードをお願いします。
今すぐアップグレードHighlights

このセクションは有料ユーザー限定です。 アクセスするには、アップグレードをお願いします。
今すぐアップグレードTranscripts

このセクションは有料ユーザー限定です。 アクセスするには、アップグレードをお願いします。
今すぐアップグレード関連動画をさらに表示

Cara Uji Regresi Linear Berganda ( Uji t, Uji f dan Uji Determinasi) menggunakan aplikasi SPSS

independen t test menggunakan SPSS

Uji t dan Uji F Lengkap dengan Penjelasanya Menggunakan SPSS

Pertemuan 6 Uji Mean One Sample T-Test

KULIAH STATISTIK - ANALISIS T-TEST

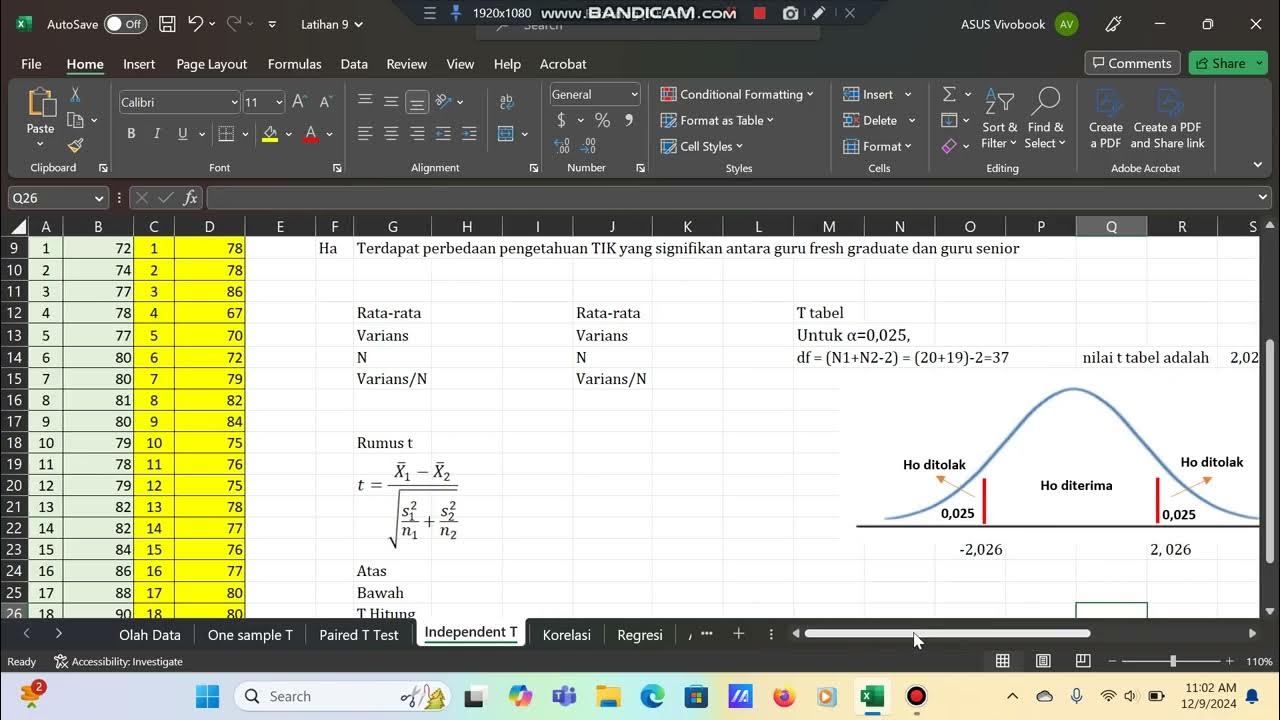
Independent samples t-test secara manual dengan bantuan Ms. Excel
5.0 / 5 (0 votes)
