Independent samples t-test secara manual dengan bantuan Ms. Excel
Summary
TLDRIn this video, the process of conducting an independent sample t-test to compare IT knowledge between fresh graduate teachers and senior teachers is explained. The researcher tests whether there is a significant difference in the average IT knowledge between the two groups, using a significance level of 5%. The steps include formulating hypotheses, calculating the t-statistic, and comparing it to critical values from a t-distribution table. The conclusion is that the null hypothesis is accepted, indicating no significant difference in IT knowledge between the two teacher groups.
Takeaways
- 😀 The video explains how to perform a **comparative hypothesis test** using the **Independent Sample T-Test** to determine if there is a significant difference between two groups.
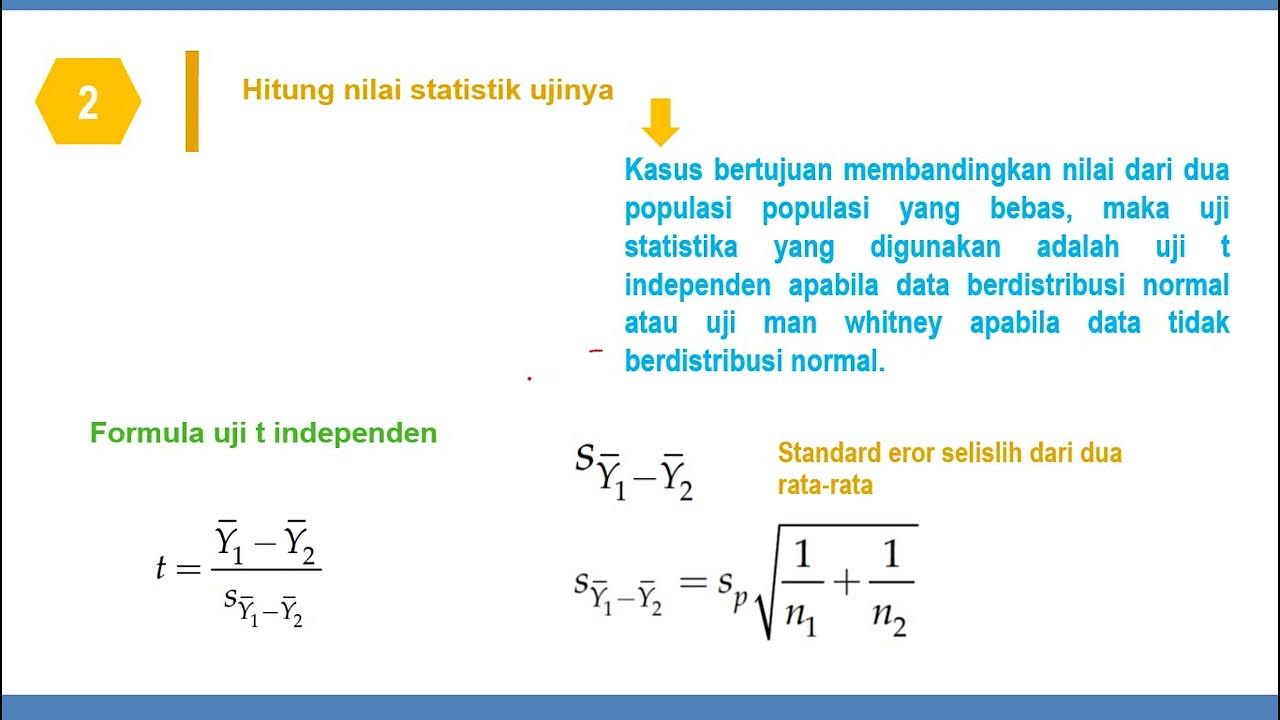
- 😀 The formula for the **Independent Sample T-Test** is: T = (X̄₁ - X̄₂) / √((s₁² / n₁) + (s₂² / n₂)), where X̄ is the sample mean, s² is the variance, and n is the sample size.
- 😀 The video provides an example comparing **ICT knowledge** between two groups of teachers: **fresh graduate teachers** and **senior teachers**.
- 😀 The **null hypothesis (H₀)** for the test states that there is **no significant difference** between the two groups' mean ICT knowledge.
- 😀 The **alternative hypothesis (H₁)** asserts that there is a **significant difference** in ICT knowledge between the groups.
- 😀 The **degrees of freedom (df)** for the test is calculated as: df = n₁ + n₂ - 2 (for two independent groups). In this case, df = 37.
- 😀 The **critical T-value** for a two-tailed test with 5% significance and df = 37 is **2.026**.
- 😀 The **calculated T-value** from the sample data is **1.506**, which is lower than the critical T-value of 2.026.
- 😀 Since the calculated T-value (1.506) is less than the critical T-value (2.026), the **null hypothesis is accepted**, meaning there is no significant difference between the two groups.
- 😀 The conclusion is that **fresh graduate teachers** and **senior teachers** do not differ significantly in their ICT knowledge based on the data provided in the study.
Q & A
What is the purpose of the independent sample t-test discussed in the video?
-The purpose of the independent sample t-test is to compare the mean IT knowledge between two independent groups, in this case, fresh graduate teachers and senior teachers, to determine if there is a significant difference.
How is the t-statistic formula for the independent sample t-test calculated?
-The t-statistic is calculated using the formula: t = (X̄1 - X̄2) / √[(Var1 / N1) + (Var2 / N2)], where X̄1 and X̄2 are the sample means, Var1 and Var2 are the sample variances, and N1 and N2 are the sample sizes.
What are the null and alternative hypotheses in this t-test?
-The null hypothesis (H₀) states that there is no significant difference in IT knowledge between fresh graduate and senior teachers. The alternative hypothesis (H₁) states that there is a significant difference in IT knowledge between the two groups.
What does the degrees of freedom (df) represent in the t-test, and how is it calculated?
-The degrees of freedom (df) represents the number of independent pieces of information used to estimate a parameter. It is calculated as df = N1 + N2 - 2, where N1 and N2 are the sample sizes of the two groups.
How do you determine the t-table value for a two-tailed t-test?
-The t-table value is determined based on the significance level (α) and the degrees of freedom (df). For a two-tailed t-test with α = 0.05, you look up the critical value for 0.025 in each tail with the corresponding df.
What is the significance level (α) used in this t-test, and what does it represent?
-The significance level (α) used is 0.05, which means there is a 5% probability of rejecting the null hypothesis when it is actually true. This represents the threshold for determining statistical significance.
How is the decision to accept or reject the null hypothesis made in a t-test?
-The decision is based on comparing the calculated t-statistic with the critical t-table value. If the calculated t-statistic falls outside the critical region (i.e., is greater than the t-table value), the null hypothesis is rejected. If it falls within the region, the null hypothesis is accepted.
What are the sample sizes for the fresh graduate teachers and senior teachers in the study?
-The sample size for fresh graduate teachers is 20, and the sample size for senior teachers is 19.
What is the outcome of the hypothesis test conducted in this study?
-The outcome of the hypothesis test is that the null hypothesis is accepted, meaning there is no significant difference in IT knowledge between the fresh graduate teachers and the senior teachers.
What statistical measure is used to calculate the variability of the sample data in the t-test?
-The variance of the sample data is used to calculate the variability in the t-test. Variance measures the spread of the data points around the mean.
Outlines

This section is available to paid users only. Please upgrade to access this part.
Upgrade NowMindmap

This section is available to paid users only. Please upgrade to access this part.
Upgrade NowKeywords

This section is available to paid users only. Please upgrade to access this part.
Upgrade NowHighlights

This section is available to paid users only. Please upgrade to access this part.
Upgrade NowTranscripts

This section is available to paid users only. Please upgrade to access this part.
Upgrade Now5.0 / 5 (0 votes)


