Properties of mean
Summary
TLDRThis video explores the concept of mean as a measure of central tendency, highlighting the gap between mathematical precision and human intuition. It illustrates how transformations, particularly nonlinear ones, can lead to misleading conclusions about averages, using height and area of squares as examples. The discussion emphasizes that only linear transformations preserve the relationship between mean and transformed values, which is illustrated graphically. Ultimately, it suggests that if one desires consistent results regardless of transformation order, the relationship must be linear, setting the stage for a new measure of central tendency to be introduced in the next video.
Takeaways
- 😀 The mean is a mathematical measure of central tendency but does not always align with intuitive concepts.
- 📏 When converting measurements (e.g., feet to inches), the mean remains consistent across units.
- ❗ Non-linear transformations, such as squaring values, disrupt the relationship of the mean.
- 🔄 For transformations to preserve the mean, they must be linear (of the form ax + b).
- 📊 The arithmetic mean does not behave intuitively under non-linear transformations.
- 💡 Intuition may suggest that applying a transformation to the mean yields the same result as transforming values first, but this is not always true.
- 📝 A graphical representation can illustrate the discrepancies in average values when transformations are applied.
- 🧮 If a transformation consistently leads to the same result regardless of the order of operations, it indicates a linear relationship.
- 🔍 The discussion encourages consideration of alternative measures of central tendency that do not face these issues.
- 🚀 The importance of understanding the limitations of mean highlights the complexity of measuring central tendency.
Q & A
What is the primary focus of the transcript?
-The transcript primarily focuses on the concept of the mean as a measure of central tendency and the nuances involved in its mathematical definition compared to human intuition.
How is the mean defined mathematically?
-The mean is defined mathematically as the sum of all values divided by the number of values, but this precise definition does not always align with human intuition about central tendency.
What example is given to illustrate the conversion of units?
-An example is given where the typical height of adult females is 5.5 feet, which intuitively converts to 66 inches. The script confirms that this conversion holds true for the mean.
What issue is raised regarding the mean and area calculations?
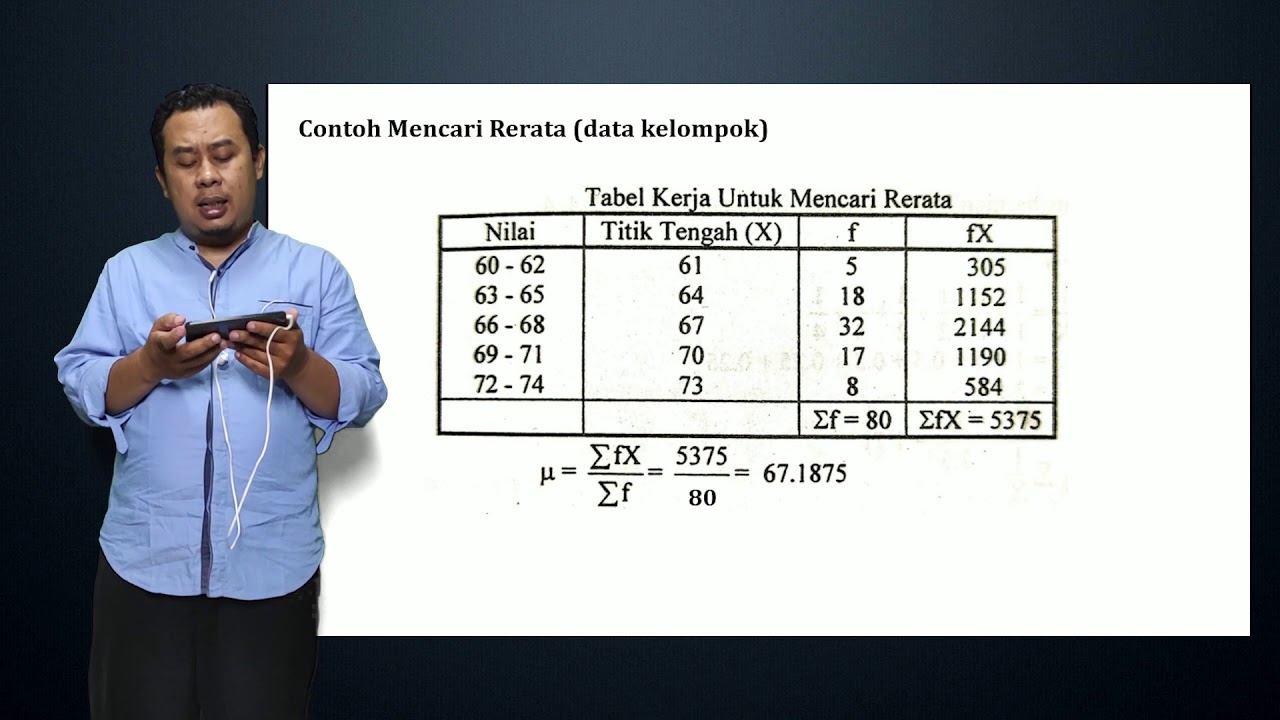
-The script discusses a situation where the mean length of squares is 3.5, but the mean of their areas is 13.5, highlighting that the mean does not transform correctly when dealing with non-linear transformations.
What intuition do people have about transformations and means?
-People often intuitively believe that applying a transformation to a dataset before or after computing the mean should yield the same result, but this is only true for linear transformations.
What graphical method is used to explain the relationship between transformations and means?
-The speaker uses a graph to show how the average of transformed values differs from the transformed average, illustrating that the order of operations affects the outcome unless the transformation is linear.
What conclusion is drawn about transformations that yield the same mean?
-It is concluded that for a transformation to yield the same mean whether applied before or after averaging, the transformation must be linear in form, specifically of the type ax + b.
What does the speaker suggest about the complexity of understanding the mean?
-The speaker acknowledges that it can be difficult to accept the limitations of the mean as a measure of central tendency and points out that other measures may avoid these issues.
What future topics does the speaker indicate will be discussed?
-The speaker suggests that they will discuss alternative measures of central tendency that are less affected by the problems associated with the mean in the next video.
How does the speaker illustrate the concept of mean with a graph?
-The speaker illustrates the concept by plotting points on a graph and demonstrating how the average of these points and the transformation of these points can lead to different results unless the transformation is a straight line.
Outlines

このセクションは有料ユーザー限定です。 アクセスするには、アップグレードをお願いします。
今すぐアップグレードMindmap

このセクションは有料ユーザー限定です。 アクセスするには、アップグレードをお願いします。
今すぐアップグレードKeywords

このセクションは有料ユーザー限定です。 アクセスするには、アップグレードをお願いします。
今すぐアップグレードHighlights

このセクションは有料ユーザー限定です。 アクセスするには、アップグレードをお願いします。
今すぐアップグレードTranscripts

このセクションは有料ユーザー限定です。 アクセスするには、アップグレードをお願いします。
今すぐアップグレード関連動画をさらに表示
STATISTIKA PENELITIAN # 7 # (MATERI) TENDENSI SENTRAL (rerata, median, dan modus)
Mean, Median and Mode in Statistics | Statistics Tutorial | MarinStatsLectures

Medidas de forma
Measure of Central Tendency - What? Why? How? || Mean || Median || Mode || Statistics for Beginners

Range, variance and standard deviation as measures of dispersion | Khan Academy

Tendensi Sentral: Mean, Median, Modus
5.0 / 5 (0 votes)
