Session 17 - Datadog Dashboard

AiOps & MLOps School
15 Oct 202216:54

Summary

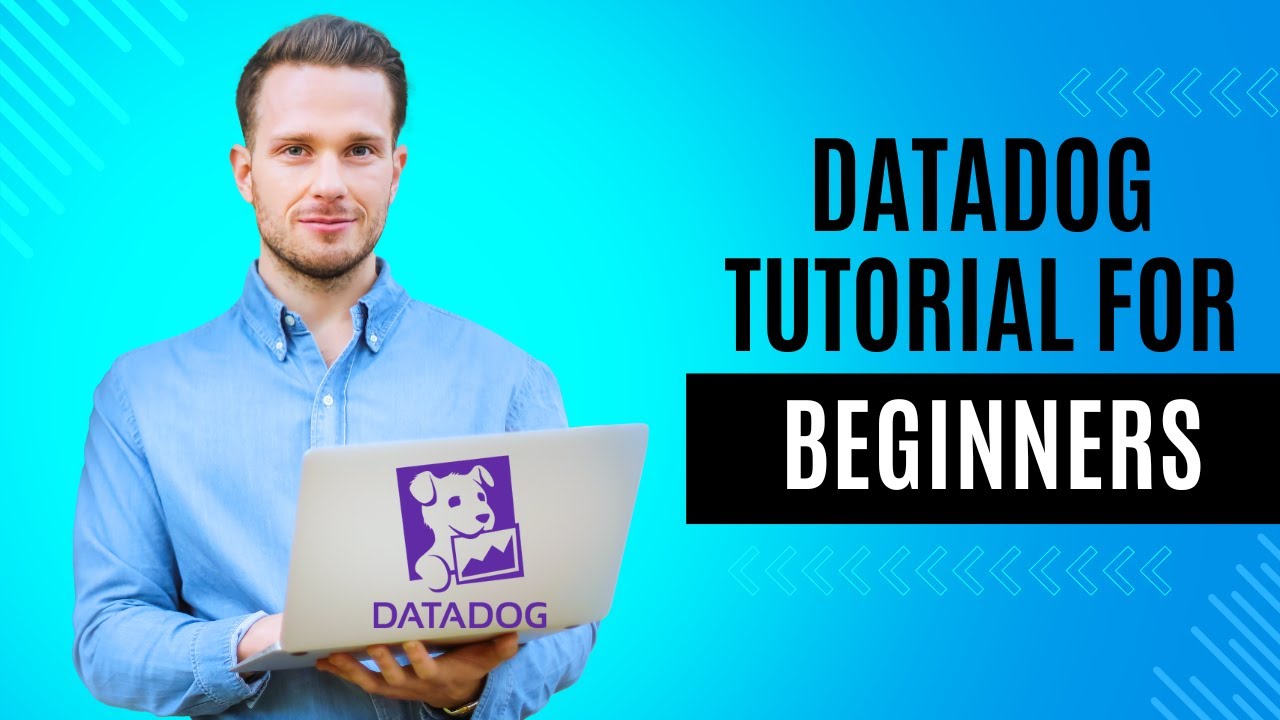
TLDRThis video tutorial from DevOps School introduces viewers to creating dashboards in Datadog. It explains the different types of dashboards available, such as Timeboard and Screenboard, and how to create a new dashboard. The instructor demonstrates various methods to populate a dashboard with graphs, including copying from existing dashboards and using Datadog's Matrix Explorer. Additionally, the video covers creating custom widgets, using queries, and suggests referencing Datadog's best practice dashboards for guidance.

Takeaways

  • 🏫 DevOps School is a leading platform offering training and certification programs in DevOps, cloud, and containers technology.
  • 📊 Datadog provides various types of dashboards including Timeboard for browsers and Screenboard for display on screens.
  • 🆓 Datadog offers pre-built dashboards for free, created based on integrations and best practices.
  • 🔍 Users can create their own dashboards and customize them with various types of graphs and widgets.
  • 📝 The script demonstrates how to 'steal' graphs from existing dashboards and incorporate them into new dashboards.
  • 🛠️ The video tutorial shows multiple methods to create graphs for a dashboard, including from Infrastructure, APM, Logs, and RUM.
  • 📈 The Matrix Explorer and other Datadog features allow users to explore metrics and export them directly to a dashboard.
  • 📑 The script emphasizes the importance of knowing what information and format is needed before creating a dashboard.
  • 🔎 Users can learn from existing dashboards and queries, then develop their own logic and customizations.
  • 💻 The tutorial encourages practice and offers additional resources such as Docker, Ansible, Jenkins, and other DevOps tools.
  • 🔑 The video mentions the option to subscribe to a Channel membership for access to more tutorials and resources.

Q & A

  • What is DevOps School and what do they offer?

    -DevOps School is a leading platform that offers training and certification programs in DevOps, cloud, and containers technology for freshers and established professionals. They ensure that training solutions are delivered by highly experienced domain experts with practical working experience.

  • What types of dashboards are mentioned in the script?

    -The script mentions three types of dashboards: Timeboard, Screenboard, and the dashboards created by Datadog. Timeboard is for browser-based dashboards, Screenboard is for displaying on large screens like TVs in an office, and Datadog provides pre-built dashboards.

  • How can you create a new dashboard in Datadog?

    -To create a new dashboard in Datadog, you go to the dashboard section where you can select 'New Dashboard' and choose the type of dashboard you want to create. The script specifically mentions creating a Timeboard dashboard named 'Devops Cool'.

  • What is the purpose of the pre-built dashboards provided by Datadog?

    -The pre-built dashboards provided by Datadog are created based on best practices and integrations. They are offered free of cost and can be used as a starting point or for reference when creating custom dashboards.

  • How can you add graphs to a dashboard in Datadog?

    -You can add graphs to a dashboard in Datadog by copying graphs from existing dashboards, using the 'Open in a dashboard' feature from various Datadog views like infrastructure, or exporting graphs directly from the Matrix Explorer, APM services, logs, or RUM.

  • What is the significance of the 'Export to Dashboard' feature mentioned in the script?

    -The 'Export to Dashboard' feature allows users to take a graph or a query from various Datadog views and directly add it to their custom dashboard, making it easier to populate dashboards with relevant data visualizations.

  • How does the script suggest improving your skills in creating dashboards?

    -The script suggests improving dashboard creation skills by initially copying and learning from existing dashboards and queries, and then gradually developing your own logic and creating custom graphs.

  • What are some of the widgets and options available for creating a custom dashboard in Datadog?

    -Datadog offers various widgets and options for creating custom dashboards, including Time Series Query, Value, Top List, Table, Text, Image, and Alerting widgets. These allow users to customize the appearance and content of their dashboards.

  • What is the importance of doing 'homework' before creating a dashboard as suggested in the script?

    -The script emphasizes the importance of planning and understanding what you want to achieve with your dashboard before creating it. This includes deciding on the data you want to display, the format, and the type of graphs or visualizations you want to use.

  • How can you access more tutorials and resources from DevOps School?

    -To access more tutorials and resources from DevOps School, you can enroll in their upcoming batches, check the link in the description for more information, or subscribe to their Channel membership for access to a wide range of DevOps related videos and playlists.

  • What is the role of the Channel membership mentioned in the script?

    -The Channel membership allows subscribers to access premium tutorials on various DevOps tools and technologies. It offers lifetime access to hundreds of playlists and thousands of videos, helping professionals to grow their skills immensely.

Outlines
00:00

📚 Introduction to Datadog and DevOps School

The video begins with an introduction to DevOps School, a leading platform for DevOps, cloud, and container technology training and certification programs. It highlights the expertise of their trainers and encourages viewers to check out their upcoming batches for more information. The presenter then dives into the topic of Datadog dashboards, explaining where to find them and the types available, such as Timeboard for browsers and Screenboard for display on screens. The presenter also mentions the pre-built dashboards provided by Datadog for free, created through integrations, and encourages viewers to explore creating their own dashboards.

05:03

📊 Creating and Customizing Dashboards in Datadog

The presenter demonstrates how to create a new Timeboard dashboard in Datadog, named 'DevOps Cool,' and explains the process of adding graphs to it. They show different methods to populate a dashboard with graphs, such as copying from existing dashboards, using the infrastructure list, and exporting from Matrix Explorer, APM services, logs, and RUM. The video emphasizes the flexibility and variety of ways to create graphs and customize dashboards according to individual needs.

10:04

🛠️ Advanced Dashboard Creation Techniques

The video continues with advanced techniques for creating dashboards, including using widgets, time series queries, value/top list tables, and heat maps. The presenter guides viewers on how to structure their queries and choose the right format for their data visualization. They also discuss the importance of knowing what kind of dashboard you want before starting to build it and suggest using the provided best practice dashboards as references. The presenter shares tips on how to learn from existing queries and gradually build your own logic for creating dashboards.

15:05

🔍 Exploring Queries and Encouraging Self-Learning

In this segment, the presenter encourages viewers to explore and understand the logic behind queries in Datadog. They show how to copy and edit queries to learn from them and create custom dashboards. The video concludes with an invitation for viewers to ask questions and try creating their own dashboards, offering additional resources such as tutorials on Docker, Ansible, Jenkins, and more with a Channel membership. The presenter also provides contact information for any issues and encourages feedback and engagement from the audience.

Mindmap

Keywords

💡Datadog

Datadog is a monitoring and analytics platform that provides insights into applications, infrastructure, and cloud services. In the video's context, it is used for creating dashboards to monitor various metrics such as server performance, application health, and log data. The script mentions how Datadog offers pre-built dashboards for free, which can be customized or used as a reference for creating new dashboards.

💡Dashboard

A dashboard in the context of the video refers to a user interface that displays the key metrics and data points in a visually accessible and organized manner. It is a central tool for monitoring and managing IT infrastructure, applications, and services. The script describes different types of dashboards available in Datadog, such as Timeboard and Screenboard, and how to create and customize them.

💡DevOps

DevOps is a set of practices that combines software development (Dev) and IT operations (Ops) to shorten the systems development life cycle and provide continuous delivery of high-quality software. The video is part of a tutorial series provided by DevOps School, which offers training and certification programs in DevOps, cloud, and containers technology.

💡Timeboard

Timeboard is a type of dashboard in Datadog specifically designed for browser-based viewing. It allows users to monitor time-based data and visualize metrics over time. The script explains how to create a new Timeboard dashboard and the flexibility it offers for users working remotely or needing a web-based monitoring solution.

💡Screenboard

Screenboard is another type of dashboard in Datadog, optimized for display on large screens such as TVs in an office environment. It is used for showcasing key performance indicators (KPIs) and other important metrics for teams to monitor collectively. The script mentions Screenboard as a useful tool for teams working in the same location.

💡APM

APM stands for Application Performance Management, which is a key aspect of DevOps focused on monitoring and managing the performance and availability of software applications. In the script, APM is mentioned in relation to Datadog's ability to track application metrics, such as the number of requests handled by a website, which can be visualized on a dashboard.

💡Integration

Integration in the context of the video refers to the process of combining different software applications and tools to work together seamlessly. The script mentions how Datadog integrates with various systems to provide pre-built dashboards that are created based on best practices and can be utilized or customized by users.

💡Widget

A widget in the context of Datadog dashboards is a reusable component that can display various types of data visualizations, such as graphs, tables, and maps. The script describes how users can add widgets to their dashboards to customize the display of metrics and data points relevant to their monitoring needs.

💡Query

In Datadog, a query is used to retrieve and display specific metrics or log data on a dashboard. The script provides examples of how to use queries to filter data, such as showing the total number of requests or errors over a certain period. Queries are essential for creating customized views and insights within dashboards.

💡Observability

Observability is a concept in software development and IT operations that refers to the ability to understand the internal state of a system through its outputs. It is often associated with monitoring tools like Datadog, which provide visibility into system performance, health, and issues. The script touches on observability by discussing how to create dashboards that monitor various aspects of system performance.

💡Certification

Certification in the video refers to the formal recognition of an individual's skills and knowledge in a particular field, such as DevOps, cloud, or containers technology. DevOps School offers certification programs to help professionals validate their expertise and stay current with industry trends and best practices.

Highlights

DevOps School offers training and certification programs in DevOps, cloud, and containers technology.

Training is delivered by experienced domain experts with practical working experience.

The tutorial focuses on creating and customizing dashboards in Datadog.

Datadog provides a list of pre-built dashboards for various needs.

There are three types of dashboards: Timeboard, Screenboard, and Dashboard Lists.

Timeboard is a browser-based dashboard suitable for individual use.

Screenboard is ideal for displaying on large screens in an office environment.

Datadog dashboards are created following best practices and are available for free.

Users can create their own dashboards or modify existing ones.

The tutorial demonstrates how to 'steal' graphs from existing dashboards.

Explains how to use the Matrix Explorer to create custom graphs.

Shows how to export graphs from APM services to a custom dashboard.

Logs can be searched and exported to a dashboard for error tracking.

RUM and synthetic tests data can be visualized and added to dashboards.

The importance of knowing what to create before jumping into dashboard creation is emphasized.

Widgets can be added to dashboards for various data presentations like time series, top list, and tables.

Users are encouraged to learn from existing dashboards and then create their own logic.

The tutorial offers a hands-on approach to learning Datadog dashboard creation.

DevOps School provides additional tutorials on Docker, Ansible, Jenkins, Terraform, Splunk, AWS, Azure, and more.

Channel membership offers access to premium tutorials and a wide range of DevOps-related content.

Transcripts

play00:00

foreign

play00:00

[Music]

play00:10

School in this video tutorial we are

play00:13

going to learn about data dog

play00:15

but before we begin let me inform you

play00:18

few things about us devops school is one

play00:20

of the leading platform which offers

play00:22

devops cloud and containers technology

play00:24

training and certification programs for

play00:26

freshers and established professionals

play00:27

who wish to update and consolidate their

play00:29

skills in the dynamic it scenario we

play00:31

ensure that the training Solutions are

play00:33

delivered by highly experienced domain

play00:35

experts with practical working

play00:36

experience in various verticals check

play00:39

out the dates and enroll with us for our

play00:40

upcoming batches for more info link and

play00:43

contact details are mentioned in the

play00:44

description below

play00:46

okay so now the question is dashboard

play00:49

so where do we find the dashboard so

play00:51

here it is

play00:52

you have a list of dashboard which you

play00:54

can create here new dashboard you can

play00:56

create here now when you create a new

play00:59

dashboard

play01:00

now you will have a three options three

play01:03

types of dashboard in fact you have

play01:06

if you read this you'll understand that

play01:08

which dashboard you want it so that

play01:11

dashboard if you want it for your

play01:12

browser then new time board dashboard

play01:15

if you want the dashboard for the screen

play01:17

screen means when I say screen that

play01:19

means let's say we all of us are working

play01:21

together at one office One locations so

play01:25

we can you know install some 120 inch

play01:27

150 inch TV and then showcase the

play01:30

dashboard over there for that the

play01:32

screenboard dashboard is very useful

play01:34

actually so right now we'll go for the

play01:36

uh time board dashboard which is a

play01:38

browser-based dashboard which you can

play01:40

work with it before that I would like to

play01:42

show you the list of dashboard

play01:44

so now if you see that here

play01:47

you know this dashboard I have not

play01:48

created it actually so you must be

play01:50

wondering from where we got it actually

play01:52

so this dashboard is nothing but uh but

play01:55

created by

play01:57

uh created by

play02:01

data docker okay so data dog has given

play02:04

you all this dashboard free of cost

play02:07

free of cost

play02:09

okay so here you see so how come they

play02:12

got this free of cost so basically you

play02:14

know this is all integration the one

play02:16

which integration you did so they

play02:19

created this dashboard and they uh you

play02:22

know this is the dashboard which has

play02:23

been created by by following the best uh

play02:26

processes and all stuff like that best

play02:28

practices so you have a dashboard you

play02:31

can use this dashboard also if you want

play02:33

you can create your own dashboard also

play02:36

so yeah we will do something

play02:39

uh with our own so right now I'm going

play02:41

to create my own dashboard actually so

play02:44

there are many ways many tricks are

play02:45

available in datadogs using that you can

play02:48

create a dashboard so let's create One

play02:50

dashboard here devops cool

play02:53

and this dashboard I'm naming it

play02:55

tomorrow

play02:56

and new time board

play03:00

create this dashboard now here

play03:04

guys here I created a dashboard now you

play03:07

have to fill the graph

play03:09

so this way I'm not starting it so I'll

play03:13

I'll teach you I'll show you how to

play03:16

steal the dashboard a graph actually so

play03:19

here lots of graph you can add it and

play03:21

how do we steal this graph so here I can

play03:24

edit the widgets and graph and all but

play03:27

not this way I want to show you all

play03:29

possible ways so let's go for data dog

play03:33

and now let's seal some graph from the

play03:36

existing

play03:37

dashboard okay so all you got I am

play03:40

trying to show you here so let's say

play03:42

this is the EPM over this APM

play03:45

graph and so many things we have from

play03:48

last uh

play03:50

one week

play03:52

okay so this is the EPM uh the APM data

play03:55

server is not running today but it was

play03:56

running till last week until last day

play03:59

so this is the graph now guys here you

play04:02

see that this button all of you

play04:06

hello

play04:08

yes now let's say you like this uh this

play04:11

graph something

play04:14

um and I'm just going randomly let's say

play04:16

you like this one so can we steal it

play04:19

so go here click on it here and click on

play04:22

copy

play04:23

simple and now you go to your own

play04:26

dashboard which is a devops which is

play04:29

devops cool

play04:31

click on Devo school one

play04:34

and paste it Ctrl B

play04:37

I got it this where this graph I stolen

play04:41

it

play04:42

from the

play04:44

existing dashboard the one which is

play04:47

given by

play04:48

data doc

play04:50

so that's the one of the method I taught

play04:52

you how to feed the graph now let me

play04:54

show you another method

play04:56

so guys here you have infrastructure

play04:58

list

play04:59

okay and here you see so many we have

play05:03

two machines running

play05:04

so now let's say you like some dashboard

play05:07

from here okay so what dashboard

play05:09

matrices are here so let's say you like

play05:12

this utilizations map and all something

play05:14

like this

play05:15

Okay so

play05:17

cancel this

play05:19

click on it

play05:21

go for open in a dashboard

play05:26

now let's say you like this one you want

play05:28

this one so what to do

play05:31

so again complete

play05:33

and I'm just trying to teach teach you

play05:37

all this

play05:38

teaching I mean all this uh cheating or

play05:42

something like that so you can use that

play05:45

taste it done so here infrastructure

play05:48

also you can get it containers also you

play05:51

can get it so you know so many ways to

play05:54

create a graph to your dashboard so many

play05:57

ways you have it

play05:59

it's up to you how do you you know do

play06:02

that

play06:03

okay so there's no container running

play06:05

I have to reduce and all stuff like that

play06:07

so okay this is the one now let's say

play06:09

you want to go for Matrix Explorer

play06:12

so I'm exploring the metrics look at

play06:15

this

play06:17

and this is the Matrix let's say I spend

play06:19

some time one hour two hours or

play06:21

something and this is the graph I wanted

play06:22

so click on the export where dashboard

play06:26

which dashboard

play06:28

double School One dashboard

play06:30

I did that

play06:32

so this is also one of the way you can

play06:35

uh from Explorer you can get it let's go

play06:38

for the APM services

play06:42

so one hour no one week I have to do and

play06:46

here this is a service

play06:49

and these are the dashboard which you

play06:51

have so many dashboard let's say appdx

play06:53

code dashboard here uh you want this one

play06:56

or you want this one depends on you so

play07:00

here you click on this export to

play07:04

devops code

play07:06

here I want this one export to

play07:10

double School you want

play07:13

something like

play07:15

this one

play07:17

or errors errors you want only in one

play07:19

Android by the way and Export to

play07:24

dashboard

play07:26

so here so easy way you can create a

play07:29

dashboard that's what I'm trying to tell

play07:31

you now if I go to the logs

play07:34

locks searches for this

play07:37

okay and here

play07:39

15 minutes to 2 days

play07:42

and you want this dashboard let's say

play07:44

you have a searches for error

play07:48

so how many errors you are having

play07:51

let me see E capital

play07:54

and how many none

play07:57

so let's keep it like this right now and

play08:00

these are the searches let's say an

play08:03

export

play08:04

export to

play08:06

dashboard

play08:08

so you created a search queries all this

play08:11

thing advance and all and

play08:14

all this thing you want to get it here

play08:17

this one also export to

play08:20

dashboard

play08:23

okay all of you now

play08:25

so this is the logs also now I'll go for

play08:29

rum

play08:31

synthetic test today only we set it up

play08:34

we have a

play08:36

few failures

play08:37

that's okay

play08:39

now which one you want you want this one

play08:42

different different regions what is the

play08:44

response time in export to dashboard

play08:48

Rajesh one done

play08:51

and then export to

play08:54

dashboard right so depends on what you

play08:57

need there's so many ways in datadoc

play09:01

which you have so you can create a

play09:03

dashboard so and this I'll taught you

play09:05

you got basically so different different

play09:08

mattress you want from the observability

play09:10

and now you see the dashboard

play09:12

so are you understanding all of you what

play09:14

I'm trying to say

play09:17

yes

play09:20

now I'll Teach You How can you create

play09:23

your own dashboard so here click on the

play09:25

widgets

play09:27

the right side you'll get a lots of

play09:29

options you have to be Masters in it

play09:32

what is your time series query value top

play09:35

list

play09:36

table and all these things a lot of

play09:38

things here you have a text free text

play09:41

image here you can summaries and all you

play09:44

can publish it here summary is just like

play09:46

a drag and drop that's all nothing else

play09:48

and here you have a list of streams you

play09:50

can do that alerting also you can check

play09:52

status alert alert graph alert value you

play09:55

can do that but here some of these

play09:57

things so times reach what time series

play10:00

this is something like Explorer okay so

play10:04

here the time series The metrics locks

play10:06

APM ROM Profile Event processes all this

play10:09

thing based on that you can populate

play10:11

here and then if you think yeah yeah

play10:14

this is your information here your times

play10:17

reach query value

play10:18

your top list table format heat map so

play10:23

do you decide what you want and then

play10:25

save it

play10:26

and now here you have this

play10:30

information one more revisits keep

play10:33

adding it

play10:35

let's say query value now this time

play10:37

instead of Matrix I'll go for the query

play10:40

value for the ROM

play10:42

and here this many total requests I have

play10:45

got it on my website

play10:47

okay

play10:49

and stuff like that so here

play10:52

you can improve this all this thing

play10:54

mathematical formulas and all you can

play10:57

improve it you can get it what you want

play10:59

display everything you have to uh you

play11:02

know do that and then save it now

play11:05

somewhere downside here it is events

play11:07

count these many events has happened

play11:09

from last one week

play11:12

okay by the way this this website I've

play11:14

been tracking from long time that's the

play11:16

reason you have too many events

play11:18

okay so now what else

play11:20

you have top list top list means I want

play11:24

to know the resources of APM so go for

play11:27

resources and here you can query add

play11:30

count whatever that you want to do add

play11:33

query

play11:35

here

play11:37

you can remove the queries all this

play11:39

thing you can do that add formulas which

play11:42

resources you want so resource name you

play11:45

have it some resources I don't remember

play11:47

that resource Name by the way let's go

play11:49

for the source actually Source I

play11:51

remember uh which was Linux I Can See

play11:53

Fire correct

play11:55

Source Linux

play11:58

should be

play12:00

okay and then searching for it there's

play12:02

no value Source Linux

play12:04

so anything

play12:07

environment plot for for more

play12:10

you will be having

play12:11

yeah

play12:13

yeah here you have

play12:15

so APM environment brought how many

play12:17

total requests you have three group buy

play12:20

and all stuff like that and save it

play12:24

so this is the way

play12:26

you can create a dashboard

play12:29

it's very easy the only thing is like

play12:31

you should know what exactly you are

play12:33

creating suddenly if you jump on then uh

play12:37

then then use very difficult to

play12:40

you know queries at I mean you should

play12:42

know what dashboard you want so first

play12:44

before jumping to the dashboard do some

play12:47

homework what dashboard you want what

play12:49

number you want in what format you want

play12:51

uh which kind of you know graph you want

play12:55

times reach table a tree map pie chart

play12:59

funnel so all this thing r d you have to

play13:01

do that and then you have to create it

play13:03

things they have given you lots of uh

play13:07

dashboard which you can also use as a

play13:11

reference so best dashboard for Docker

play13:14

best dashboard for jvm best dashboard

play13:17

for nginx best dashboard if you if

play13:20

you're lost then these are the reference

play13:22

queries and all you can see that okay so

play13:26

one hour instead of let's make it four

play13:28

hours see that these are the best

play13:30

dashboard now you want to see the logic

play13:32

so that's very also easy

play13:34

you can

play13:37

create in view

play13:39

and this is the logic actually

play13:43

okay this is the query

play13:45

event count over

play13:48

this is the to face it actually remember

play13:52

that while querying this you are doing

play13:54

that face it or not

play13:59

okay so you can read the queries also

play14:01

and gradually learn this is the one of

play14:04

the things we want to read the queries

play14:06

for this this is the query is

play14:09

hmm

play14:12

I just want to see that query

play14:17

okay I can copy

play14:19

and also paste it so this query I think

play14:23

is inbuilt that's the reason I cannot

play14:25

use that so you can copy this data and

play14:28

you can change this edit and all you can

play14:31

if you if you copy this let me let me

play14:33

copy this whole things

play14:36

okay

play14:38

here and then after that once you copy

play14:40

then you can add it also

play14:43

so let's go for

play14:45

double School

play14:47

and here Ctrl B

play14:50

and now you can edit you see here so you

play14:53

can steal their queries like this this

play14:54

is the queries see here Ram session

play14:59

all this thing Top by 250 and also some

play15:02

of that so this is you you can learn

play15:04

from the existing one slowly and then

play15:07

create your own

play15:12

uh logic are you understanding all of

play15:15

you

play15:21

yeah so I would suggest create your own

play15:24

dashboard first time you cheat

play15:26

you copy from the defination places and

play15:28

then do that after that you develop your

play15:32

own some of the graph with your own

play15:34

logic uh examples you can copy simply

play15:37

and learn from them and this is the way

play15:40

you can create a dashboard

play15:43

okay so go ahead I'll give you 20 to 30

play15:45

minutes to play around it if you have

play15:47

any questions you can ask me and after

play15:49

that we'll get into the some sort of

play15:51

test

play15:53

along with that you can access our other

play15:55

tutorials such as Docker ansible Jenkins

play15:58

terraform Splunk AWS Azure and various

play16:01

other devops related premium tutorials

play16:03

with our Channel membership if you would

play16:06

have any issues with our Channel

play16:07

membership you can drop an email to us

play16:08

at contact devopschool.com or you can

play16:11

also unsubscribe from Channel membership

play16:12

anytime if you don't want to continue or

play16:14

did not like the video to get our

play16:16

Channel membership click onto the join

play16:18

button select the 399 plan and grow your

play16:20

skills immensely please be kind enough

play16:22

to like it and you can comment any of

play16:24

your doubts and queries we will reply to

play16:26

them at the earliest thanks for watching

play16:29

hello everyone if you would like to

play16:32

access the remaining videos of this

play16:34

playlist of 50 plus more tools which are

play16:36

coming under devops Dave secops SRE data

play16:39

Ops get Ops Etc kindly become our

play16:43

channel members by clicking on the

play16:44

joining button

play16:46

you would have access to one hundreds of

play16:48

playlists and one thousands of videos

play16:50

lifetime access with this membership

play16:52

enjoy

Rate This

5.0 / 5 (0 votes)

関連タグ
DatadogDashboardDevOpsTrainingCertificationCloudContainersIT SkillsMonitoringObservability
英語で要約が必要ですか?