Las 7 Herramientas de Control de Calidad
Summary
TLDRWelcome to the course on the seven quality control tools with Ana Cruz. By the end, you'll understand the concept of quality control, its benefits, and the seven key tools. Learn how these tools can enhance your business, reduce defects, increase customer satisfaction, and lower costs. Discover the history and development of these tools, starting from the 1930s and 1940s in Japan, to their formalization by Dr. Ishikawa in the 1960s. Explore each tool: from cause-and-effect diagrams to control charts, and learn practical applications for both production and service industries.
Takeaways
- 📚 The course introduces the seven quality control tools and their significance in improving business operations.
- 👨🏫 Dr. Kaoru Ishikawa is recognized for defining the seven quality control tools and promoting total quality control.
- 🔍 Quality control involves developing, designing, producing, and marketing products and services to minimize costs and ensure customer satisfaction.
- 📉 The seven tools include the check sheet, cause and effect diagram, control chart, histogram, Pareto chart, scatter diagram, and flowchart.
- 📈 The control chart is used to monitor process stability and differentiate between common and special causes of variation.
- 📊 The histogram helps to understand variation within a set of data and calculate process capability indices like Cp and Cpk.
- 📋 The check sheet is a simple but powerful tool for organizing information and preventing errors in tasks.
- 🐟 The cause and effect diagram, also known as the fishbone diagram, systematically arranges the effects and their influencing factors to clarify causes of a problem.
- 📊 The Pareto chart classifies problems by type and quantity, highlighting the most significant issues to address quickly.
- 📑 The scatter diagram examines the correlation between variables, helping to understand relationships that may or may not be associated.
Q & A
Who is Ana Cruz and what is her role in the course?
-Ana Cruz is the presenter of the course on the seven quality control tools. She welcomes the participants and guides them through the module.
What does the course aim to teach about quality control?
-The course aims to teach participants what quality control means, its benefits, and introduce the seven tools of quality control.
Who is Dr. Ishikawa and what is his contribution to quality control?
-Dr. Ishikawa is recognized for defining what is now known as the seven tools of quality control. He emphasized the importance of total quality control and helped disperse quality control efforts throughout the organization.
What is the definition of quality control according to Dr. Ishikawa?
-Dr. Ishikawa defined quality control as developing, designing, producing, and announcing products and services with the most effective strategy to save costs and ensure customers buy the products knowing they are good.
What are the benefits of implementing quality control?
-The benefits of quality control include a reduction in the number of defective products, increased customer satisfaction, and lower costs for the company due to less waste and more efficient production.
What is the first tool of the seven quality control tools mentioned in the script?
-The first tool mentioned is the graph, which is used to easily present information for comparison and decision-making.
What is the purpose of the inspection template, the second tool in the seven tools of quality control?
-The inspection template is used to organize information and ensure that tasks are completed without issues, helping to prevent errors.
How does the Pareto chart, the third tool, help in quality control?
-The Pareto chart classifies problems and defects by type and quantity, highlighting the most significant issues that need to be addressed quickly.
Who is Wilfredo Pareto and why is the Pareto chart named after him?
-Wilfredo Pareto was an Italian economist who first identified the 80/20 rule. The Pareto chart is named in his honor as it helps to identify the vital few issues that cause most of the problems.
What is the cause and effect diagram, also known as the fishbone diagram, and how does it aid in problem-solving?
-The cause and effect diagram, or fishbone diagram, systematically arranges the results of effects and the factors influencing them, helping to clarify the causes and reasons behind a problem.
What is the purpose of the scatter diagram, the fifth tool of quality control?
-The scatter diagram is used to examine the correlation between variables by adding corresponding information, helping to understand the relationship between two variables.
What does the histogram, the sixth tool, reveal about a set of data?
-The histogram is a graphical representation of numerical data in the form of vertical bars, revealing the variation or differences within a set of numbers and helping to calculate process capability indices like CP and CPK.
How does the control chart, the seventh tool, contribute to quality control?
-The control chart is used to monitor the stability of a process by comparing quality values against control limits, helping to identify common causes or special causes of variation.
What software is mentioned for creating the seven quality control tools?
-Microsoft Excel and the statistical software SigmaXL are mentioned for creating the seven quality control tools.
Outlines

このセクションは有料ユーザー限定です。 アクセスするには、アップグレードをお願いします。
今すぐアップグレードMindmap

このセクションは有料ユーザー限定です。 アクセスするには、アップグレードをお願いします。
今すぐアップグレードKeywords

このセクションは有料ユーザー限定です。 アクセスするには、アップグレードをお願いします。
今すぐアップグレードHighlights

このセクションは有料ユーザー限定です。 アクセスするには、アップグレードをお願いします。
今すぐアップグレードTranscripts

このセクションは有料ユーザー限定です。 アクセスするには、アップグレードをお願いします。
今すぐアップグレード関連動画をさらに表示

Project Quality Management PMBOK 5 | PMP® Training Videos | Project Management Tutorial |Simplilearn

Project Quality Management

AULA 1 - QUALIDADE E PRODUTIVIDADE
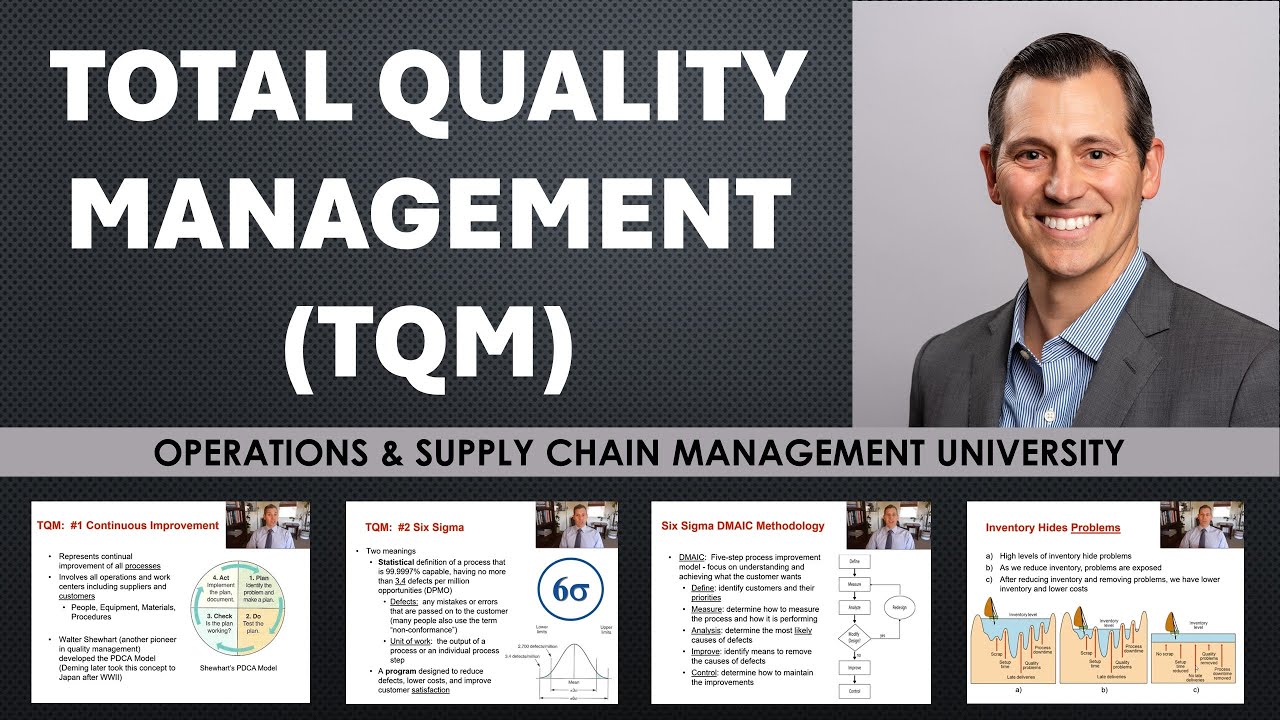
Total Quality Management (TQM) overview, including Six Sigma, Benchmarking & Just-in-Time concepts
Intro to the course QA Functional Testing
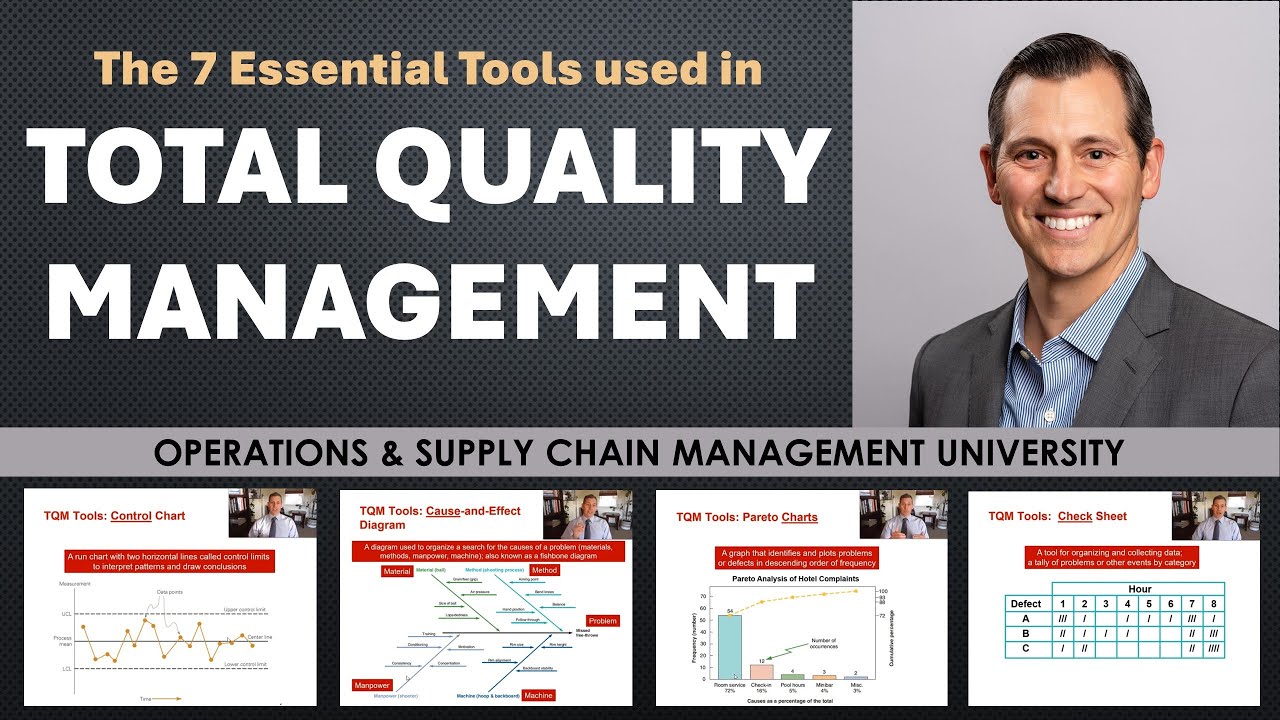
The Seven Tools of Total Quality Management (TQM)
5.0 / 5 (0 votes)
