Project Quality Management - Processes and Seven Basic Quality Management Tools - AIMS UK
Summary
TLDRThis video script delves into the concept of quality management, emphasizing its significance in meeting customer expectations and requirements. It outlines the core processes of quality management, including planning, assurance, and control, and introduces seven fundamental quality tools developed by Kaoru Ishikawa. The script also distinguishes between quality and grade, accuracy and precision, and highlights the proactive nature of quality assurance versus the reactive approach of quality control, ultimately aiming to enhance project success and customer satisfaction.
Takeaways
- 📈 Quality is defined as the degree to which a project meets its requirements and is fit for its intended use from a customer's perspective.
- 🛡️ Quality management involves creating and following policies and procedures to ensure a project meets its intended requirements.
- 🤝 Customer satisfaction is a key aspect of quality, focusing on meeting expectations and requirements of customers and stakeholders.
- 🛠️ Quality is achieved through prevention, planning, designing, and building it into a product or process from the inception.
- 💼 Management responsibility is crucial for the success of quality efforts, requiring organizational support and financial resources.
- 🔄 Continuous improvement in quality and process relies on the ongoing Plan-Do-Check-Act cycle.
- 📊 Understanding the difference between quality and grade is important; quality is about conformance to requirements, while grade is a rank assigned based on technical characteristics.
- 📉 Low quality is not acceptable, but a low grade can be, as long as the product or service meets quality standards.
- 📝 The core processes of project quality management include Plan Quality Management, Perform Quality Assurance, and Control Quality.
- 🔍 Quality assurance is proactive, focusing on improving processes to prevent defects, while quality control is reactive, detecting and correcting defects.
- 📈 The seven basic quality tools, developed by Kaoru Ishikawa, are widely used for analyzing and interpreting data in quality management.
Q & A
What is the definition of quality in the context of project management?
-In project management, quality is defined as the degree to which the project fulfills requirements, meeting the expectations and needs of the customer and stakeholders from their perspective.
What are the key components of quality management?
-Quality management includes creating and following policies and procedures to ensure that a project meets the defined needs it was intended to meet.
How does customer satisfaction relate to quality management?
-Customer satisfaction is central to quality management as it focuses on meeting the expectations and requirements of the customer and creating a product that is fit for its intended use.
What is the significance of prevention in achieving quality?
-Prevention is crucial for quality because it involves planning, designing, and building quality into a product or process from the inception, thereby avoiding the need for corrections later on.
What role does management responsibility play in quality management?
-Management responsibility is essential as the project team must ensure the success of quality efforts, and organizational management must provide the necessary financial resources for these efforts to succeed.
Can you explain the concept of continuous improvement in quality management?
-Continuous improvement in quality management relies on the ongoing plan-do-check-act cycle, which is a systematic approach to incremental process and product improvement.
What is the difference between quality and grade?
-Quality refers to how well the characteristics of a product meet the demands or expectations of the project, while grade is a category or rank assigned to products or services with the same functional use but different technical characteristics.
What does it mean if a product or service is of low quality but high grade?
-A product or service of low quality is usually not acceptable, but being of a high grade means it has certain technical characteristics that may be acceptable despite not meeting the highest quality standards.
What are the three core project quality management processes?
-The three core project quality management processes are plan quality management, perform quality assurance, and control quality.
Can you describe the purpose of the 'plan quality management' process?
-The 'plan quality management' process identifies quality requirements and standards for the project and its deliverables, and documents how the project will demonstrate compliance with relevant quality requirements.
What are some of the basic quality tools mentioned in the script?
-Some of the basic quality tools mentioned are the cause and effect diagram, flowcharts, check sheets, Pareto diagrams, histograms, control charts, and scatter diagrams.
How does the cause and effect diagram, also known as the fishbone diagram, assist in problem-solving?
-The cause and effect diagram helps in problem-solving by identifying and organizing the possible causes of an effect or problem, serving as a first step in analyzing and addressing the issue.
What is the purpose of a flowchart in quality management?
-A flowchart in quality management is a graphical representation of a process that shows the relationships among process steps, helping to identify points where quality problems might occur.
How does a check sheet aid in organizing facts about a potential quality problem?
-A check sheet is a structured form used to collect and analyze data, which helps in organizing facts about a potential quality problem, especially when repeated data is collected from the same source or effect.
What is the purpose of a Pareto chart in quality management?
-A Pareto chart is used to identify and prioritize problems to be solved, applying the 80/20 rule to focus on the most significant factors causing problems or contributing to outputs.
What does a histogram represent in quality management?
-A histogram in quality management is a special form of bar chart used to describe the central tendency, dispersion, and shape of a statistical distribution, providing insights into the data without considering the influence of time.
How does a control chart help in assessing the performance of a process?
-A control chart is a graphical display of results over time that is used to assess whether a process is in control or out of control, with lines indicating average, upper control limit, and lower control limit based on historical data.
What is the difference between quality assurance and quality control?
-Quality assurance is a proactive process focused on planning to avoid defects, while quality control is a reactive process focused on detecting and correcting defects. Quality assurance is process-based, whereas quality control is product-based.
What are the key benefits of performing quality control?
-The key benefits of performing quality control include validating that deliverables meet requirements, identifying causes of poor product quality, and recommending actions to eliminate quality-related problems.
What is the role of a quality audit in quality management?
-A quality audit is an example of quality assurance, used to evaluate the effectiveness of quality management processes and identify areas for improvement.
Outlines

This section is available to paid users only. Please upgrade to access this part.
Upgrade NowMindmap

This section is available to paid users only. Please upgrade to access this part.
Upgrade NowKeywords

This section is available to paid users only. Please upgrade to access this part.
Upgrade NowHighlights

This section is available to paid users only. Please upgrade to access this part.
Upgrade NowTranscripts

This section is available to paid users only. Please upgrade to access this part.
Upgrade NowBrowse More Related Video

Concept Of Quality

CBME 1 | Lesson 1 | Part 2/3
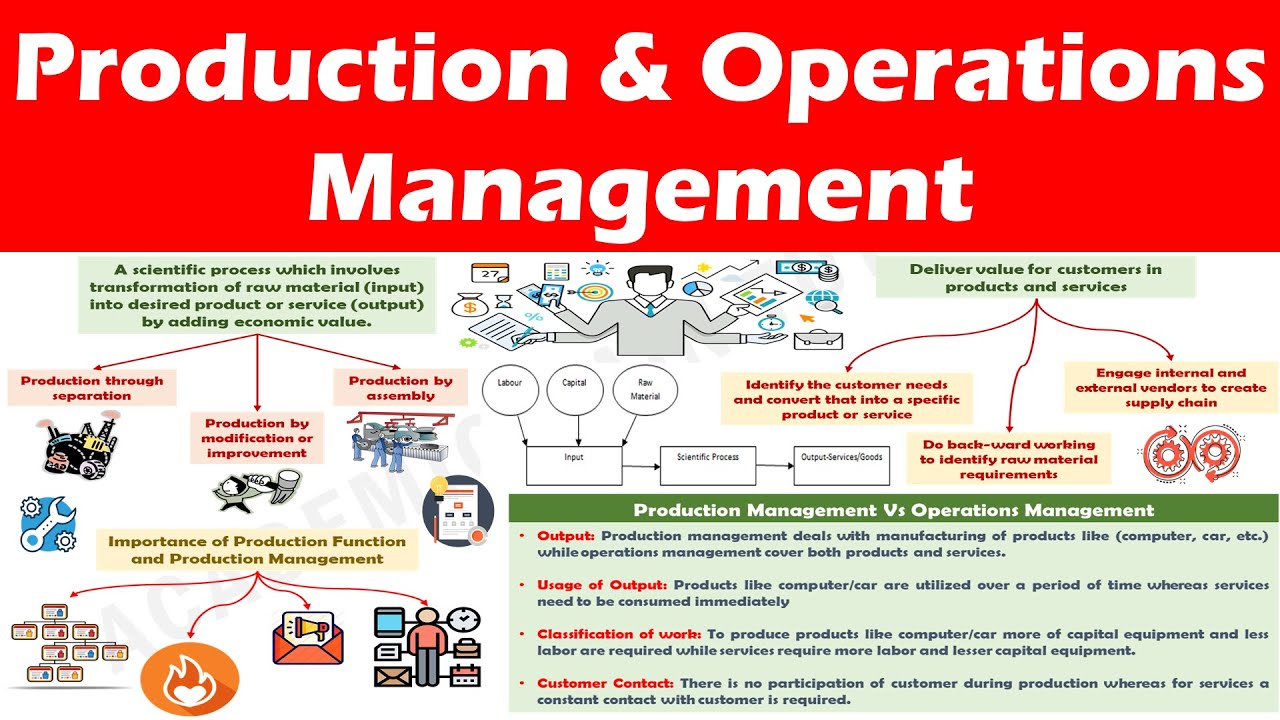
Production and Operations Management - Understanding the concept.
What Is A Quality Management System (QMS) | Introduction To Quality Management System | Simplilearn

Introduction Best Lean Six Sigma Black Belt Tutorial For Beginners | @Six Sigma by Henry Harvin

CBME 1 | Lesson 2 | Part 1/3
5.0 / 5 (0 votes)