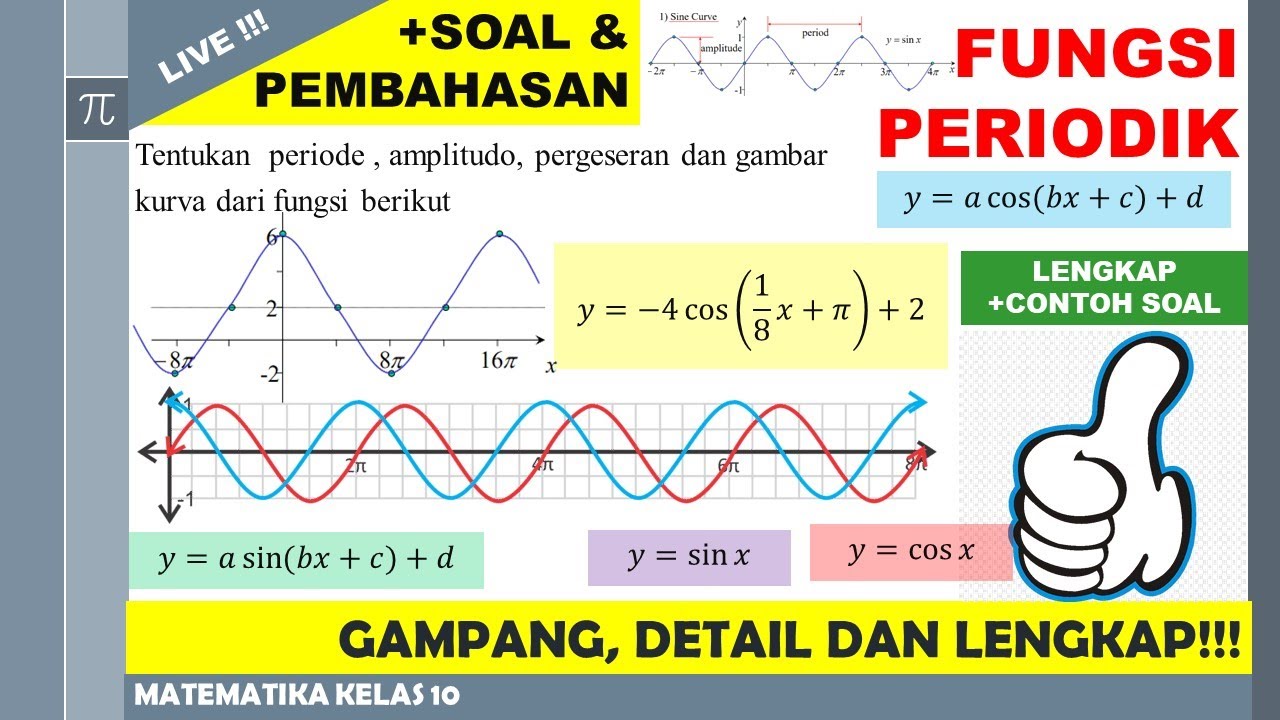
Trig functions grade 11 and 12: Horizontal shift
Summary
TLDRThis educational video tutorial focuses on the horizontal shifting of trigonometric graphs, specifically using the sine function as an example. The instructor explains the concept of shifting, distinguishing it from stretching, and guides viewers on how to use a calculator to plot the graph of 'sin(x) - 30' over the interval 0 to 360 degrees. The tutorial covers the process of setting up the calculator for the graph, determining the step size based on the period of the graph, and plotting the points. It also touches on the importance of identifying key features like amplitude, range, domain, and period of the graph, and how these are affected by horizontal shifts.
Takeaways
- 📈 The lesson focuses on horizontal shifts in trigonometric graphs, specifically how they move in the horizontal direction.
- 🔄 Horizontal shifting involves moving the entire graph to the left or right, unlike vertical stretching which affects the graph's amplitude.
- ✏️ The instructor demonstrates how to use a calculator to graph the function 'sin(x) - 30' over the interval of 0 to 360 degrees.
- 📱 The calculator is set to 'table' mode, and the equation 'sin(x) - 30' is entered to generate the necessary x and y values for plotting.
- 📐 The step size for the calculator is determined by dividing the period of the graph (360 degrees) by 4, resulting in a step size of 90 degrees.
- 📉 The amplitude of the graph remains unchanged at 1, as horizontal shifts do not affect the graph's height from its resting position.
- 📋 The range of the graph is from -1 to 1, reflecting the minimum and maximum y-values of the sine function.
- 🗺️ The domain is specified as from 0 to 360 degrees, which is the interval over which the graph is drawn.
- ⏳ The period of the sine graph remains 360 degrees, as horizontal shifts do not alter the graph's periodicity.
- 🔍 The instructor points out the limitations of using a calculator for graphing, such as not being able to accurately determine turning points due to the shift.
Q & A
What is the primary focus of the lesson described in the transcript?
-The primary focus of the lesson is to understand how trigonometric graphs can be shifted horizontally, specifically by exploring the effect of a horizontal shift on the sine graph.
What is the difference between shifting and stretching in the context of trigonometric graphs?
-Shifting refers to moving the graph horizontally or vertically without changing its shape or size, while stretching involves altering the period or amplitude of the graph, which changes its size and appearance.
How does the instructor suggest using a calculator to graph the function sin(x) - 30 over the interval 0 to 360?
-The instructor suggests using the calculator's table function to find the values of the function over the interval 0 to 360, with a step size of 90 (which is 360/4, as the period of the sine graph is 360 degrees).
What is the significance of the step size chosen for the calculator in this lesson?
-The step size of 90 is significant because it corresponds to one-fourth of the period of the sine graph, ensuring that the graph captures all the important points within the given interval.
Why does the instructor emphasize that the highest y-value on the graph should be 1, even though the calculator might show a different maximum?
-The instructor emphasizes that the highest y-value should be 1 because the sine function has a range from -1 to 1, and the calculator's maximum value might not always reflect the true range of the function over the interval considered.
What are the amplitude, range, and period of the graph of the function sin(x) - 30?
-The amplitude of the graph is 1, as it's the maximum distance from the resting position. The range is from -1 to 1, reflecting the y-values of the sine function. The period remains 360 degrees, as the function has only been shifted, not stretched or compressed.
How does the horizontal shift of -30 degrees affect the turning points of the sine graph?
-A horizontal shift of -30 degrees to the right moves the turning points of the sine graph from (90, 0) and (270, 0) to (120, 0) and (300, 0) respectively.
What is the domain of the graph of the function sin(x) - 30 as described in the lesson?
-The domain of the graph is from 0 to 360, as specified in the instructions for drawing the graph.
Why does the instructor caution against relying solely on the calculator for graphing trigonometric functions?
-The instructor cautions against relying solely on the calculator because it may not provide all the necessary points, such as the shifted turning points, which require understanding the transformation of the graph.
How does the instructor suggest completing the graph of sin(x) - 30 when the calculator cannot fill in all the gaps?
-The instructor suggests using the knowledge of the sine function's properties, such as its turning points and period, to fill in the missing gaps and complete the graph accurately.
Outlines

このセクションは有料ユーザー限定です。 アクセスするには、アップグレードをお願いします。
今すぐアップグレードMindmap

このセクションは有料ユーザー限定です。 アクセスするには、アップグレードをお願いします。
今すぐアップグレードKeywords

このセクションは有料ユーザー限定です。 アクセスするには、アップグレードをお願いします。
今すぐアップグレードHighlights

このセクションは有料ユーザー限定です。 アクセスするには、アップグレードをお願いします。
今すぐアップグレードTranscripts

このセクションは有料ユーザー限定です。 アクセスするには、アップグレードをお願いします。
今すぐアップグレード5.0 / 5 (0 votes)


