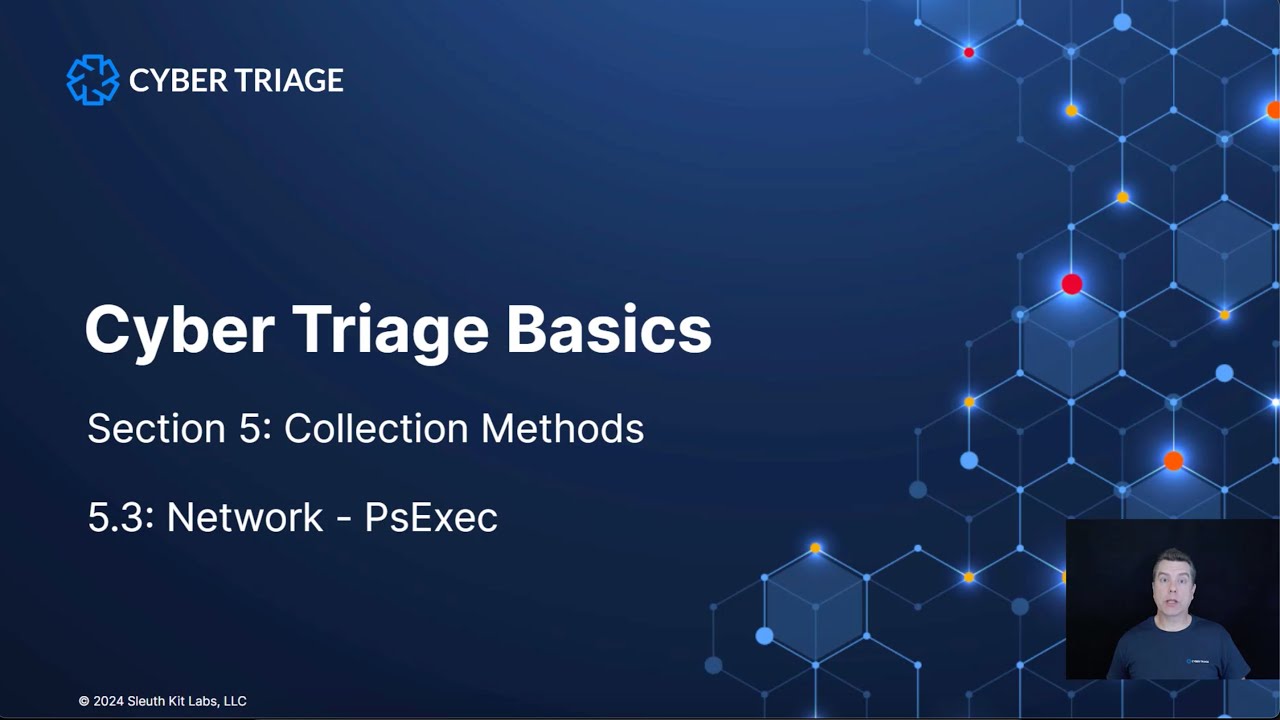
Introduction to Cyber Triage - Fast Forensics for Incident Response

13Cubed
3 Aug 202019:08

Summary

TLDRThis video offers an in-depth look at Cyber Triage, an automated Incident Response tool. It supports Windows XP and newer, collecting volatile data, malware persistence mechanisms, and file metadata without installation on the target system. Created by Brian Carrier, it provides a free 'Lite' version for basic forensics and paid 'Standard' and 'Team' versions. The demo showcases analyzing a Windows 10 disk image and memory capture, highlighting suspicious items and system details. The tool simplifies forensic analysis, though a basic understanding of forensic artifacts is recommended for accurate interpretation.

Takeaways

  • 👨‍💻 The video discusses Cyber Triage, an automated Incident Response software, which can be used for forensic analysis on various Windows systems.
  • 🛠️ It offers a collection tool that can be pushed to endpoints or run manually from a USB Drive without installation on the target system.
  • 🔍 Cyber Triage can process disk images, memory captures, and utilize Volatility for analyzing memory artifacts.
  • 👨‍💼 Developed by Brian Carrier, known for 'File System Forensic Analysis' and 'Autopsy', Cyber Triage has strong credentials in the forensics field.
  • 💾 It collects a wide range of data including volatile data, file metadata, and even content from suspicious files.
  • 🆓 A free 'Lite' version is available, providing substantial forensic capabilities, while 'Standard' and 'Team' are commercial versions.
  • 💻 The demo in the video analyzes an E01 disk image and a memory capture from a Windows 10 system using Cyber Triage.
  • 🔎 The software flags suspicious data and automates the analysis process, helping analysts identify potential threats.
  • 💼 Cyber Triage is user-friendly, allowing analysts to quickly generate reports and timelines from the collected data.
  • 🔑 It provides a high-level overview, which is beneficial for analysts to quickly identify possible malicious activities, though a basic understanding of forensics is recommended for deeper analysis.

Q & A

  • What is Cyber Triage and what does it do?

    -Cyber Triage is an automated Incident Response capability software that runs on all versions of Windows XP and newer. It utilizes a collection tool that can be pushed to endpoints or run manually from a USB Drive or other removable media. It can also process an L1 or raw disk image or a memory capture using Volatility on the backend.

  • Who created Cyber Triage?

    -Cyber Triage was created by Brian Carrier, the author of 'File System Forensic Analysis' and the creator of Autopsy and TSK, which gives the software significant credibility in the field of digital forensics.

  • What types of data does Cyber Triage collect?

    -Cyber Triage collects volatile data including running processes, open ports, logged-in users, active network connections, DNS cache, malware persistence mechanisms, user activity, file metadata from all files on the system, and even file content from suspicious files.

  • Is there a free version of Cyber Triage available?

    -Yes, there is a free version called 'Lite' which allows users to collect volatile and filesystem data, analyze memory images, pivot through collected data, determine scope, view timelines, and generate reports.

  • How does the automated analysis process in Cyber Triage work?

    -The automated analysis process in Cyber Triage flags any suspicious data and looks for things that are known to be evil or possibly evil. It then requires the analyst to determine whether those flagged items warrant further investigation.

  • What is the significance of the National Software Reference Library (NSRL) in Cyber Triage?

    -The National Software Reference Library (NSRL) is a national database of software that Cyber Triage can use to compare and identify known software on a system. However, during the demo, the NSRL was not specified, indicating that the software can operate without it, but it might limit the software's ability to identify certain software.

  • What is the purpose of the 'PS exec settings' in Cyber Triage?

    -The 'PS exec settings' in Cyber Triage allow the software to push itself to a remote host, facilitating remote incident response capabilities without needing physical access to the endpoint.

  • What does the memory capture analysis in Cyber Triage involve?

    -The memory capture analysis in Cyber Triage involves running Volatility plugins to automatically enumerate and analyze memory data, such as running processes, network connections, and other artifacts, to identify potential malicious activity.

  • How does Cyber Triage handle false positives?

    -Cyber Triage, like any forensic tool, may flag items that are not actually malicious. The software provides detailed information about each flagged item, but it is up to the analyst to verify and determine the true nature of the flagged items, considering the context and other evidence.

  • What recommendations does the presenter have for using Cyber Triage effectively?

    -The presenter recommends having at least a basic understanding of forensic artifacts before using Cyber Triage to avoid misinterpreting the results. While the software provides a high-level view and quick insights, it is important for the analyst to have contextual knowledge to make informed decisions about the findings.

Outlines

00:00

🔍 Introduction to Cyber Triage

The paragraph introduces Cyber Triage, an automated Incident Response software that can run on all versions of Windows XP and newer. It can be deployed through a collection tool that can be remotely pushed or manually run from a USB drive without installation on the target system. It also processes disk images and memory captures using Volatility. The software was created by Brian Carrier, known for 'File System Forensic Analysis' and 'Autopsy'. It collects various data including running processes, open ports, user activity, and file content from suspicious files. There's a free 'Lite' version available, as well as commercial versions like 'Standard' and 'Team'. The speaker will demonstrate analyzing a disk image and a memory capture in a live demo.

05:01

🖥️ Analyzing a Disk Image with Cyber Triage

The speaker demonstrates how to use Cyber Triage to analyze a disk image. They guide through the process of selecting the disk image, configuring settings, and initiating a full scan. The scan results show 47 suspicious items but no high threats. The software flags potential threats, enumerates user data, login information, network shares, and programs run. It also provides a timeline and system configuration details. The speaker emphasizes the self-explanatory nature of the software, allowing for easy identification and analysis of potential threats.

10:02

💾 Memory Image Analysis using Cyber Triage

The paragraph describes the process of analyzing a memory image with Cyber Triage. The speaker sets up a new session, selects the memory capture file, and chooses an appropriate Volatility profile. They explain the options available for memory image analysis, such as checking for network processes, programs run, and startup items. The analysis reveals critical errors, suspicious items, and bad items, including a notably suspicious svchost.exe process. The software provides detailed information about user accounts, network shares, and program execution artifacts, along with a timeline of activities and system configuration details. The speaker highlights the software's user-friendly interface and its ability to quickly provide a high-level view of potential threats.

15:03

🔗 Conclusion and Recommendations on Cyber Triage

The speaker concludes the discussion on Cyber Triage by emphasizing its ease of use and the comprehensive analysis it provides. They caution against relying solely on the software for forensic analysis without a basic understanding of forensic artifacts. The software offers a high-level overview that can quickly identify potential threats. The speaker recommends trying the free version of Cyber Triage and considers the commercial versions to be competitively priced. They encourage viewers to explore the tool and appreciate its capabilities in providing a 30,000-foot view of potential digital forensics issues.

Mindmap

Keywords

💡Cyber Triage

Cyber Triage is an automated Incident Response capability software that assists in the forensic analysis of computer systems. It is designed to run on all versions of Windows XP and newer, providing a quick and efficient way to collect and analyze data from endpoints. In the video, the software is highlighted for its ability to process disk images and memory captures, which is crucial for identifying potential security threats or breaches.

💡Endpoint

An endpoint in the context of the video refers to a remote host or device that is part of a network. Cyber Triage can push its collection tool to these endpoints, which is a crucial feature for remote data collection in incident response scenarios. The video demonstrates how the software can be used to analyze data from endpoints, which is essential for understanding the state of a system and identifying potential security issues.

💡Volatility

Volatility is an open-source memory forensics framework that is used by Cyber Triage to analyze memory captures. It is mentioned in the script as the backend tool that processes memory images and provides valuable insights into the system's state at the time of capture. The video emphasizes the importance of memory forensics in incident response, showcasing how Cyber Triage leverages Volatility to analyze and flag suspicious activities.

💡Malware Persistence Mechanisms

Malware persistence mechanisms refer to the techniques used by malware to ensure it continues running on a system even after a reboot or system restart. Cyber Triage collects data related to these mechanisms, such as startup items and scheduled tasks, which are critical for identifying and removing persistent threats. The video script mentions this as part of the software's capabilities, highlighting its comprehensive approach to incident response.

💡Forensic Analysis

Forensic analysis, as discussed in the video, involves the examination of computer systems to gather evidence for security incidents or breaches. Cyber Triage aids in this process by providing automated tools to collect and analyze data from endpoints and memory images. The video emphasizes the importance of a forensic approach in incident response, as it helps in understanding the nature and extent of security incidents.

💡Disk Image

A disk image, as mentioned in the script, is a complete copy of a disk's contents, which can be used for backup or forensic analysis. Cyber Triage can process disk images to analyze the state of a system at a particular point in time. The video demonstrates how the software can be used to analyze disk images from a Windows 10 system, showcasing its capability to extract valuable information for forensic purposes.

💡Memory Capture

Memory capture refers to the process of creating a snapshot of a system's memory, which is crucial for memory forensics. In the video, Cyber Triage is shown to analyze memory captures from Windows systems, helping to identify active processes, network connections, and other runtime information. The script highlights the importance of memory captures in incident response, as they provide insights into the system's state at the time of the snapshot.

💡Suspicious Items

Suspicious items in the context of the video are indicators or artifacts found during the analysis that may suggest malicious activity. Cyber Triage flags these items for further investigation by the analyst. The video script describes how the software identifies and lists suspicious items, such as certain processes or files, which are then reviewed to determine if they pose a threat.

💡Incident Response

Incident response is the process of detecting, analyzing, and responding to security incidents or breaches. Cyber Triage is an automated tool designed to aid in this process by quickly collecting and analyzing data from endpoints and memory. The video script emphasizes the importance of incident response in cybersecurity and how Cyber Triage streamlines this process through its various features and capabilities.

💡Free Version

The free version of Cyber Triage, as mentioned in the script, is a lite version of the software that offers basic forensic capabilities at no cost. This includes the ability to collect volatile and filesystem data, analyze memory images, and generate reports. The video highlights the value of the free version, suggesting that it provides significant forensic value despite its limited scope compared to the commercial versions.

Highlights

Cyber Triage offers automated Incident Response capabilities.

It is compatible with all versions of Windows XP and newer.

The collection tool can be pushed to endpoints or run manually from removable media without installation.

Cyber Triage can process disk images, memory captures, and utilize Volatility on the backend.

Developed by Brian Carrier, author of 'File System Forensic Analysis' and creator of Autopsy and TSK.

It collects volatile data such as running processes, open ports, logged-in users, and active network connections.

Malware persistence mechanisms, user activity, and file metadata are also collected.

Cyber Triage Lite version is completely free and offers extensive forensic capabilities.

Commercial versions like Standard and Team provide additional features.

The software flags suspicious data and automates analysis to identify known or potentially malicious items.

A live demo will analyze a Windows 10 disk image and a memory capture to showcase the results.

Cyber Triage provides a warning if no NSRL file is configured, which is a database of known software.

The software allows setting up options like timezone, network settings, and malware settings.

Analysts can choose to upload files for external malware analysis or mark them as suspicious.

The software quickly identifies suspicious items and provides a detailed breakdown of potential threats.

Cyber Triage generates a timeline and system configuration report for further analysis.

The tool is designed for ease of use, allowing even those with basic forensic knowledge to perform analysis.

The presenter emphasizes the importance of understanding forensic artifacts before relying on automated tools.

Cyber Triage is praised for providing a high-level overview for quick incident response.

Different versions of the tool are available, with a free version and competitively priced commercial options.

Transcripts

play00:06

let's talk about cyber triage just the

play00:09

quick note before we begin this is not a

play00:12

sponsored episode I was provided with a

play00:14

license so that I could evaluate the

play00:16

software but I was under no obligation

play00:17

to create a 13 cubed episode covering

play00:20

this content I chose to do so because I

play00:22

think it's actually going to be very

play00:23

beneficial to many of you watching this

play00:25

so with that out of the way what does

play00:28

cyber triage even do well it provides an

play00:32

automated Incident Response capability

play00:34

it runs on all versions of Windows XP

play00:37

and newer it utilizes a collection tool

play00:40

that can be pushed to endpoints or it

play00:42

can be manually run on an endpoint from

play00:44

a USB Drive or other removable media

play00:47

doing either requires no installation on

play00:50

the target but it can also just process

play00:53

an l1 or raw disk image or a memory

play00:56

capture utilizing volatility on the back

play00:59

end these last two points the disk

play01:02

images and memory captures are what

play01:03

we're actually going to take a look at

play01:05

in the live demo coming up next it was

play01:08

created by Brian carrier author of

play01:10

filesystem forensic analysis and of

play01:13

course autopsy and TSK so plenty of

play01:16

street cred here this is not created by

play01:18

some sort of fly-by-night forensics

play01:20

company what does it collect well it

play01:24

collects volatile data including running

play01:26

processes open ports logged in users

play01:28

active network connection DNS cache also

play01:31

malware persistence mechanisms including

play01:34

startup items and scheduled tasks user

play01:36

activity including what programs were

play01:38

run web activity logins file metadata

play01:42

from all files on the system and even

play01:44

file content from suspicious files so

play01:47

maybe I should have said what does it

play01:48

not collect right how does it work well

play01:52

if you actually use the option to push

play01:55

it to an end point or run the tool from

play01:57

a USB Drive on an end point then you

play01:59

have this collection tool that Flags any

play02:02

suspicious data and you have an

play02:04

automated analysis process that goes

play02:06

through and just basically looks for

play02:08

things that are known evil or possibly

play02:10

evil and then it's up to you as the

play02:12

analyst to determine whether or not

play02:13

those things warrant further

play02:14

investigation how much does it cost

play02:18

well here's the cool thing there's

play02:19

actually a light version it's completely

play02:21

free

play02:22

and as you can see from the capabilities

play02:24

it allows you to collect volatile and

play02:26

filesystem data you can even collect

play02:28

data to USB Drive analyze memory images

play02:31

pivot through the collected data to

play02:33

determine scope view timelines and

play02:35

generate reports so a lot of stuff for

play02:38

free now of course there are some

play02:40

commercial versions like standard and

play02:42

team that you see here I'm evaluating

play02:44

the standard version but again the Lite

play02:47

free version still provides plenty of

play02:49

forensic value so with that out of the

play02:53

way let's talk about the demo we're

play02:56

going to analyze an eeo one image from a

play02:58

Windows 10 box and then check out the

play03:00

results then we'll analyze a memory

play03:03

capture from a Windows 10 box and review

play03:06

those results so let's go ahead and hop

play03:09

over to a Windows 10 analysis

play03:11

workstation and get started all right

play03:17

we're at our windows 10 analysis VM and

play03:19

we'll go ahead and launch cyber triage

play03:21

and take a look at the options available

play03:23

to us first off though you'll notice

play03:25

this warning saying that no in SRL file

play03:28

has been configured we'll come back to

play03:29

that in a minute let's go ahead and

play03:30

choose no for now we can choose new

play03:33

session open session or open incident

play03:36

but first let's check out the options

play03:38

option this will provide a list of

play03:41

options used by the software the first

play03:43

being the national software reference

play03:45

library or in SRL which is a national

play03:49

database of software now of course we're

play03:52

going to leave that unset for now and

play03:54

then the PS exec settings is what will

play03:57

allow cyber triage to push itself to a

play03:59

remote host we'll leave that blank as

play04:01

well we are going to change the time

play04:03

zone to UTC however because that is the

play04:05

only time zone you should be using for

play04:07

forensic analysis under network settings

play04:10

we can set up proxy under malware

play04:12

settings we can clear cache and safe

play04:14

results from previous scans deployment

play04:17

mode is just single user basic

play04:19

deployment for this demo whitelist of

play04:21

course is a list of known good blacklist

play04:23

is a list of known bad stuff dynamic DNS

play04:27

is a list of the D DNS providers the

play04:29

software knows about and the license

play04:31

info

play04:31

contains information about the license

play04:34

go figure

play04:35

let's go ahead and choose okay and we're

play04:37

going to choose the new session option

play04:40

and now we have five options live

play04:44

automatic means that cyber triage will

play04:45

push the collection tool to a remote

play04:47

host live manual means the collection

play04:50

tool is manually run from a network or

play04:52

USB drive on the remote host and then

play04:56

live file means the same except the data

play04:58

saved to the USB Drive warp to a network

play05:00

share and manually imported we're going

play05:02

to be taking a look at the last two disk

play05:04

image in memory image first up though

play05:07

disk image this will allow us to point

play05:10

to an l1 or raw disk image let's go

play05:12

ahead and choose demo for our incident

play05:14

name we'll type in localhost for the

play05:16

host name and now let's browse for an l1

play05:19

file we're going to use for this first

play05:21

part of the demo I happen to have a

play05:24

Windows 10 full disk image that's about

play05:26

15 gigs in size and there you see it so

play05:30

let's go ahead and choose that when we

play05:33

do it populates the source file in the

play05:35

field and now we'll simply click

play05:37

continue for the full scan which is what

play05:40

we're going to be using you'll notice

play05:41

everything is checked except some of the

play05:43

volatile data which is used in the

play05:45

memory portion and then we can also

play05:47

choose a custom scan or skip file scan

play05:50

again we're going to use a full scan

play05:52

find all the things that you can find in

play05:55

other words let's go ahead and choose

play05:57

continue and at this point we have the

play05:59

option to query external services to get

play06:03

malware results now the radio button is

play06:05

set to upload the file so it can be

play06:08

analyzed but for opposite purposes you

play06:10

may want to go ahead and just tell it to

play06:12

mark the file as suspicious but not

play06:14

uploaded which I would recommend in most

play06:16

cases so having selected that I click

play06:20

start collection we can expand the

play06:22

status here but after a few seconds

play06:24

what's going to happen is you're going

play06:26

to see the full screen window appear of

play06:29

course it tells us the NSR el database

play06:31

was not specified so we'll click OK and

play06:33

now we're off to the races of course I

play06:35

have greatly sped this up it's going to

play06:38

take a variable amount of time we do see

play06:41

the Windows Defender firewall prompt

play06:43

let's go ahead and tell it to allow

play06:44

access

play06:45

so that cyber triage can go ahead and do

play06:47

its thing and run some queries to

play06:49

determine whether or not it finds any

play06:50

evil and you'll notice the suspicious

play06:53

item count is growing fairly rapidly so

play06:57

we have at the end of the scan 47

play07:00

suspicious items and as you can see all

play07:02

ten steps have completed and no tasks

play07:05

are currently running we have zero high

play07:08

threats in this case and again 47

play07:10

suspicious so let's go ahead and take a

play07:13

look at the left column here under bad

play07:16

items again we have none but we have 47

play07:18

suspicious items and it's very

play07:21

self-explanatory you can see them there

play07:23

on the Left what it thinks are threats

play07:25

and in this case some of these are

play07:28

indeed blacklisted password dumping

play07:30

tools as you can see and other that it

play07:33

may have flagged as interesting or

play07:35

possibly suspicious because they're

play07:37

running out of app data local here we

play07:39

see the users present within this disk

play07:41

image which is handy we see some login

play07:44

information with a couple of IP

play07:46

addresses here if we click on one of

play07:48

these you'll notice more information you

play07:50

can see that this is an outgoing

play07:51

connection you'll notice the local user

play07:54

involved the remote host IP address

play07:56

remote user and various other

play07:58

information this is from the inti user

play08:00

data registry key under terminal server

play08:03

client servers we have network shares

play08:06

here which are enumerated from the image

play08:08

again very useful programs run sothank

play08:11

things like prefetch or we can determine

play08:13

exactly what has executed on the system

play08:16

and if you notice that scroll bar on the

play08:18

right side there's a lot of stuff here

play08:20

as you would expect as we scroll down

play08:22

through here we can kind of get an idea

play08:24

of exactly what was being run on this

play08:27

Windows 10 system so quite a bit of

play08:30

useful information under programs run

play08:33

under web artifacts we don't really have

play08:36

anything to show in this demo under

play08:38

startup items we do have quite a few

play08:40

things though this is going to of course

play08:42

enumerate the good ole run key and

play08:45

numerous other locations from which

play08:46

programs can start automatically on our

play08:49

Windows systems quite a few things here

play08:52

we would need to look at but according

play08:53

to this there's only one suspicious item

play08:56

under triggered tasks again quite a few

play08:59

things

play08:59

one of which is flagged because of the

play09:01

location from which it's running no

play09:03

processes because that's gonna come from

play09:05

memory right we don't have that

play09:07

information here same with active

play09:09

connections not connected or not

play09:11

collected rather from a disk image

play09:13

listening ports same DNS cache nothing

play09:17

here registry Keys no suspicious entries

play09:20

found under files we do have a few

play09:22

things that it did flag for whatever

play09:25

reason it flagged USB detective which is

play09:27

absolutely not evil under timeline it's

play09:30

actually built a rudimentary timeline

play09:32

for us showing us timestamps and UTC and

play09:35

under system configuration we get some

play09:38

information about the system

play09:39

configuration from that particular

play09:41

system from which this disk image was

play09:43

acquired so again I just breezed through

play09:46

that because it's very self-explanatory

play09:47

I'm not going to insult your

play09:49

intelligence by explaining what each of

play09:51

those things are because I think you'll

play09:52

agree it's very easy to figure out

play09:54

what's going on here it's almost to the

play09:56

point of click a button and find evil so

play10:00

obviously you do have to perform some

play10:02

analysis but still very easy now let's

play10:05

go ahead and make another new session

play10:06

this time though for the memory image so

play10:10

for our incident name let's choose demo

play10:12

two because I can't think of anything

play10:14

better to type here under host name

play10:17

we'll go ahead and type in localhost

play10:18

again and for our source file we're

play10:22

going to go ahead and browse to a memory

play10:24

capture I haven't half which is named

play10:27

after the correct profile that we're

play10:29

going to be using in this case you'll

play10:31

notice the name actually is from Windows

play10:34

10 built 17 134 so under the volatility

play10:38

profile drop-down I'm going to go ahead

play10:40

and choose Windows 10 x64 build 17 134

play10:45

so that'll save us some time we won't

play10:47

have to run image info or kdb g-scan on

play10:50

the back end to try to determine which

play10:52

profile volatility should use we'll

play10:55

click continue here and as you can see

play10:58

some things are unchecked because

play11:00

they're not really applicable to a

play11:01

memory image but we can choose a custom

play11:04

scan here again a lot of things are

play11:06

grayed out because they're not

play11:08

applicable we could choose network

play11:09

processes programs run

play11:12

startup items and that's really about it

play11:15

if we go back however to the skip file

play11:18

scan you'll notice it's pretty much

play11:20

exactly what's been chosen there so I'm

play11:22

going to go ahead and just use skip file

play11:24

scan and just stick with the default

play11:26

options really and click start

play11:28

collection and as you might imagine this

play11:30

tool is simply running volatility on the

play11:33

back end automatically and aggregating

play11:35

the results force I'll go ahead and

play11:38

click past this dialog as before and

play11:40

again I'm going to greatly speed this up

play11:42

you'll notice here though it's running

play11:44

PS list gets id's mal find various other

play11:47

volatility plugins we've talked about

play11:49

numerous times in other introduction to

play11:52

memory forensics episodes so at this

play11:54

point it is complete and this time

play11:56

you'll notice we have a critical error

play11:58

message where a requested registry key

play12:01

that volatility tried to enumerate user

play12:03

assist in this case was not found that's

play12:06

okay

play12:06

remember there's no guarantees in memory

play12:08

forensics some stuff may be there it may

play12:11

not be there so don't freak out if you

play12:13

see an error message here and there as

play12:15

the memory image is trying to be

play12:16

enumerated notice the rudimentary

play12:19

timeline on the right side for a

play12:21

suspicious bunch of SVC host processes

play12:24

and notice we have a bunch of bad items

play12:27

this time eight in total whereas we had

play12:29

none in the disk image and you'll notice

play12:32

it flagged Explorer and svchost.exe

play12:36

which is always a favorite for malware

play12:40

authors so clicking on any one of these

play12:42

will provide more detail as always but

play12:46

particularly I would focus in on the

play12:48

svchost.exe s and I can tell you in this

play12:51

memory image there's definitely some

play12:53

wonky stuff going on with SVC host that

play12:56

path below the highlighted area there

play12:59

you'll notice windows svchost.exe well

play13:02

that's not the right path for

play13:03

svchost.exe for sure

play13:05

we can click on all these other tabs

play13:07

though to get additional information and

play13:10

as before it's very self-explanatory

play13:12

you'll notice user account related

play13:14

information and details just pretty much

play13:17

anything that was able to be enumerated

play13:19

from the various volatility plugins that

play13:22

were run

play13:24

have execution history we have

play13:26

information about startup items various

play13:29

things like that of course I can expand

play13:30

any of the columns here so it fits but

play13:33

again start off items nothing here

play13:35

sessions nothing here and our analysis

play13:38

results as you can see the score is bad

play13:40

the confidence is high and the software

play13:43

is correct this is evil again clearly

play13:46

evil especially because of the name and

play13:48

path of that svchost.exe and posture

play13:52

process but clicking on any one of these

play13:55

will give us more details below and we

play13:58

can scroll through and click on any of

play14:00

these very self-explanatory very easy

play14:03

and user-friendly so for suspicious

play14:06

items we have 10 things here that were

play14:08

flagged for various reasons again some

play14:10

of these are in fact evil so looking at

play14:14

this one we have notepad we have smart

play14:16

screen dot exe which is interesting

play14:18

because it's often flagged to buy mal

play14:20

find as it was in the description as you

play14:23

can see here and that is actually a

play14:25

false positive that mal fine reports on

play14:27

every time so interesting there you can

play14:29

ignore that one for users we have the

play14:32

users that was able to enumerate from

play14:34

the memory image CTF being one of the

play14:37

main users if we scroll down through

play14:40

here and start clicking on all of these

play14:41

various things here's some network share

play14:43

related information which could be

play14:45

potentially useful to us and as you can

play14:48

see we have AC : path here under windows

play14:51

system32 w bim we have programs run

play14:55

again program execution artifacts that

play14:57

were able to be derived from memory

play15:00

which is very cool things we've talked

play15:02

about in previous memory forensics

play15:04

episodes no web artifacts a few startup

play15:08

items one of which is flagged as

play15:10

suspicious

play15:10

no triggered tasks here is an awesome

play15:14

output of a tree based list of our

play15:16

processes which I really really like

play15:18

this so very very easy kind of like PS

play15:21

tree if you will but we have a GUI

play15:23

version of it where we can go in and

play15:25

look at the parent-child relationships

play15:26

and find anything that might be

play15:28

suspicious or bad you'll notice the

play15:31

icons like this one for example says bad

play15:34

and again that's another one of our evil

play15:37

spc host dot exe processes in this image

play15:39

and as we continue to scroll down

play15:41

through this you'll notice again the

play15:43

yellow and the red icons which represent

play15:46

the suspicious or bad items respectively

play15:50

for active connections we actually do

play15:52

have some things here that we can expand

play15:54

see a bunch of remote IP addresses here

play15:57

that we might want to take a look at all

play15:58

on 80 and 443 some of these could for

play16:02

example be c2 listening ports might be

play16:05

of interest to us you see a bunch of

play16:07

svchost.exe with the dash k options here

play16:10

which are probably legit but again we

play16:12

would want to look through this stuff

play16:13

and verify DNS cache registry entries

play16:16

nothing here of interests same with

play16:18

files here's a timeline that it built

play16:20

for us based on time based artifacts out

play16:24

of our memory image all in UTC very cool

play16:27

that it makes a timeline for us and very

play16:30

useful information here about process

play16:32

creation ports that are opened things

play16:35

that are run active connections very

play16:39

useful information and for system

play16:41

configuration as before it's pulled some

play16:44

things out of the memory image most of

play16:46

which we already knew

play16:47

but still very interesting information

play16:49

overall so that's cyber triage we looked

play16:54

at a disk image and we looked at a

play16:56

memory image and as you can see it's

play17:00

almost the point of point-and-click

play17:02

forensics you guys have heard me say

play17:04

this over and over and over again I am

play17:07

NOT one to believe that you should just

play17:09

put software in front of a person with

play17:11

no forensics knowledge and have them

play17:13

click buttons and make assumptions about

play17:16

what has happened on a particular system

play17:18

in other words I saw this thing called

play17:20

prefetch and it says here that that

play17:22

means something ran so clearly something

play17:24

ran on the system at this time well

play17:26

while that may be true if the analyst

play17:29

looking at it doesn't really understand

play17:31

the underlying meaning of any of these

play17:33

artifacts that may not be so good so I

play17:36

would recommend at least a basic

play17:37

understanding of what these forensic

play17:39

artifacts are before you go just click a

play17:42

button and have a tool output a bunch of

play17:44

stuff for you that you're expected to

play17:45

know what it is

play17:46

you can't just click the solve case a

play17:48

button and expect everything to be happy

play17:51

that said this software goes a long way

play17:53

to provide what I like to call a 30,000

play17:56

foot view it's basically a very

play17:58

high-level view that we can derive very

play18:01

quickly by simply opening a beautifully

play18:04

designed and really pretty GUI clicking

play18:06

the Browse button clicking on a disk

play18:09

image or a memory image as we just saw

play18:11

and basically saying show me some stuff

play18:13

here that may be evil and let me figure

play18:16

it out there are different flavors of

play18:18

the tool available and you can certainly

play18:20

download a free version and actually

play18:22

play around with it and even the

play18:24

commercial versions are very

play18:25

competitively priced compared to other

play18:27

commercial tools that I've seen in this

play18:30

space so I hope you found this

play18:33

information useful and I hope you will

play18:35

check this out

play18:36

but that's it for now so as always thank

play18:40

you for watching thank you for

play18:42

subscribing and I will catch you in the

play18:44

next episode

play18:54

you

Rate This

5.0 / 5 (0 votes)

関連タグ
Cyber TriageIncident ResponseForensics AnalysisMemory ForensicsDisk Image AnalysisMalware DetectionDigital ForensicsSecurity ToolsThreat HuntingCybersecurity
英語で要約が必要ですか?