Break-even Analysis | Breakeven Chart, Formula (In 4 minutes)
Summary
TLDRThis video introduces break-even analysis, explaining its importance in calculating a business's margin of safety based on revenue and costs. It covers the formula to determine the break-even point, which includes fixed costs, variable costs, and sales price. The video also explains how to construct a break-even chart, showing the relationship between costs, revenues, and sales volume. Key concepts such as margin of safety, the angle of incidence, and the limitations of break-even analysis are discussed. The video concludes by encouraging viewers to explore more details through a provided link.
Takeaways
- 📊 Break-even analysis helps determine when a business's total revenue equals its total cost.
- 💡 It is used to evaluate profitability and assess the margin of safety in a business.
- 🧮 The break-even point can be calculated using the formula: Fixed Cost divided by (1 minus Variable Cost per unit divided by Selling Price per unit).
- 📈 Break-even analysis can be conducted using both algebraic and graphical methods.
- 📉 A break-even chart visually represents the relationship between cost, revenue, and output levels.
- 🧾 The Y-axis of a break-even chart shows total cost and total revenue, while the X-axis represents output or sales volume.
- 📏 Fixed costs remain constant regardless of production level and are shown as a horizontal line.
- 📊 Total cost increases with production and includes both fixed and variable costs.
- 💰 The sales revenue line shows income generated at different output levels.
- ⚖️ The break-even point is where total cost equals total revenue, resulting in no profit and no loss.
- 🔻 The area before the break-even point indicates losses, while the area after it represents profits.
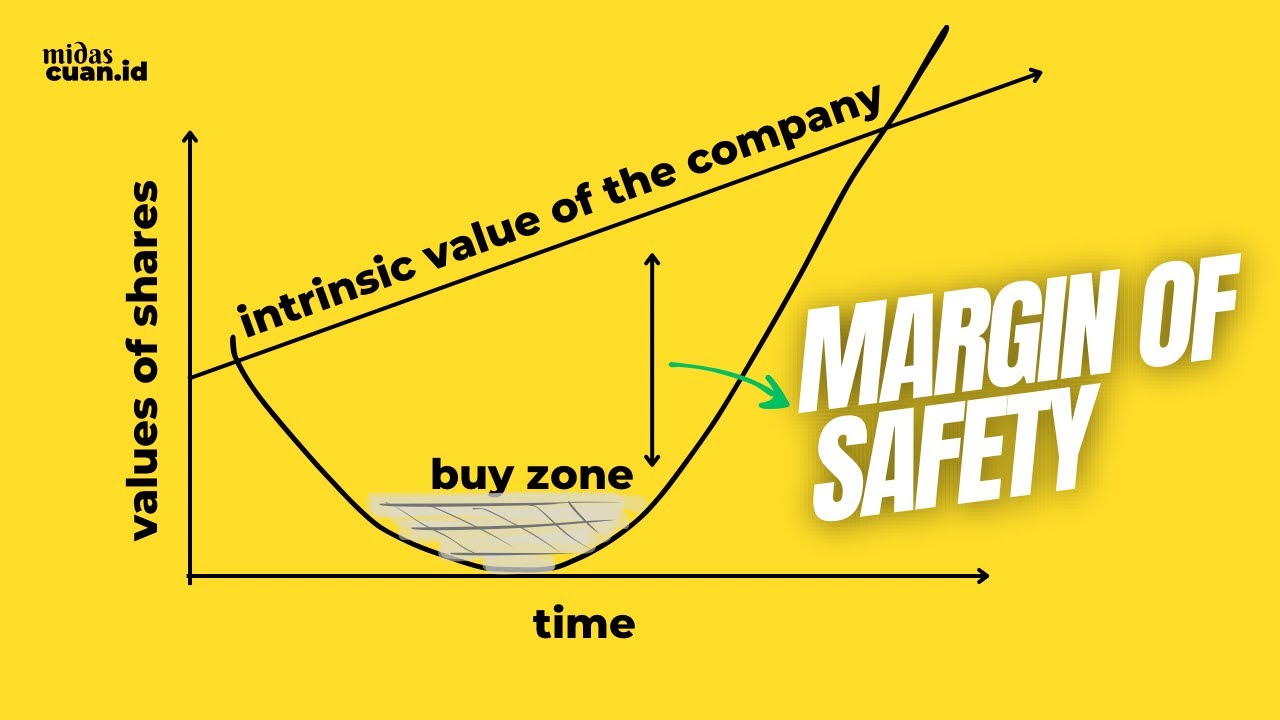
- 🛡️ Margin of safety measures how much sales can drop before the business reaches the break-even point.
- 📐 The angle of incidence reflects the rate of profit generation; a larger angle indicates higher profitability.
- ⚠️ Break-even analysis has limitations, such as assuming constant market conditions and linear cost behavior.
- 🔄 It becomes complex when dealing with multiple products or varying cost structures.
Q & A
What is break-even analysis?
-Break-even analysis helps in calculating and examining the margin of safety of a business by comparing the revenues collected and associated costs. It determines the point at which total revenue equals total costs, meaning no profit or loss.
How is the break-even point calculated?
-The break-even point is calculated using the formula: Break-even point = F / (1 - V / P), where 'F' is fixed costs, 'V' is the variable cost per unit, and 'P' is the selling price per unit.
What does the break-even chart represent?
-The break-even chart is a graphical representation that shows the relationship between cost and revenue. It helps determine the break-even point and illustrates profit potential under varying output and cost conditions.
What does the fixed cost line (line A) represent on the break-even chart?
-The fixed cost line (line A) represents costs that do not change with the increase in sales volume. These costs remain constant regardless of the output.
What does the total cost line (line B) represent on the break-even chart?
-The total cost line (line B) represents the sum of fixed and variable costs, which increases linearly with the increase in the volume of production. It shows how total costs rise as production increases.
What does the sales revenue line (line C) represent on the break-even chart?
-The sales revenue line (line C) represents the income generated from sales at varying output levels. It shows how revenue increases as the number of units produced or sold rises.
What is the significance of the break-even point on the chart?
-The break-even point is the point where the total cost line and the sales revenue line intersect. At this point, there is neither a profit nor a loss, as total revenue equals total costs.
What is the margin of safety in break-even analysis?
-The margin of safety is the distance between the break-even point and the actual production output. A large margin indicates that profit will remain even with a significant drop in sales or production, while a small margin suggests that even a slight drop could reduce profits considerably.
What is the angle of incidence in break-even analysis?
-The angle of incidence is the angle at which the sales revenue line cuts the total cost line. A larger angle indicates that profit is growing at a high rate, while a small angle suggests slower profit growth.
What are some limitations of break-even analysis?
-Some limitations include: (1) The break-even point may be difficult to determine due to fluctuating market conditions. (2) The total cost line assumes fixed and variable costs increase in direct proportion, which may not be the case in reality. (3) The analysis becomes complex when an enterprise produces multiple products.
Outlines

Cette section est réservée aux utilisateurs payants. Améliorez votre compte pour accéder à cette section.
Améliorer maintenantMindmap

Cette section est réservée aux utilisateurs payants. Améliorez votre compte pour accéder à cette section.
Améliorer maintenantKeywords

Cette section est réservée aux utilisateurs payants. Améliorez votre compte pour accéder à cette section.
Améliorer maintenantHighlights

Cette section est réservée aux utilisateurs payants. Améliorez votre compte pour accéder à cette section.
Améliorer maintenantTranscripts

Cette section est réservée aux utilisateurs payants. Améliorez votre compte pour accéder à cette section.
Améliorer maintenantVoir Plus de Vidéos Connexes

Break-even Analysis Explained with Charts in 9 minutes

Modelo costo - volumen - utilidad

IGCSE Business Studies: Chapter 4.2: Costs, scale of production and break-even analysis
MAS: COST-VOLUME-PROFIT (CVP) ANALYSIS
Cost-Volume-Profit (CVP) Analysis- Break-even Point (Part 1)
Kekeliruan Saya Soal Margin of Safety dan Target Price
5.0 / 5 (0 votes)
