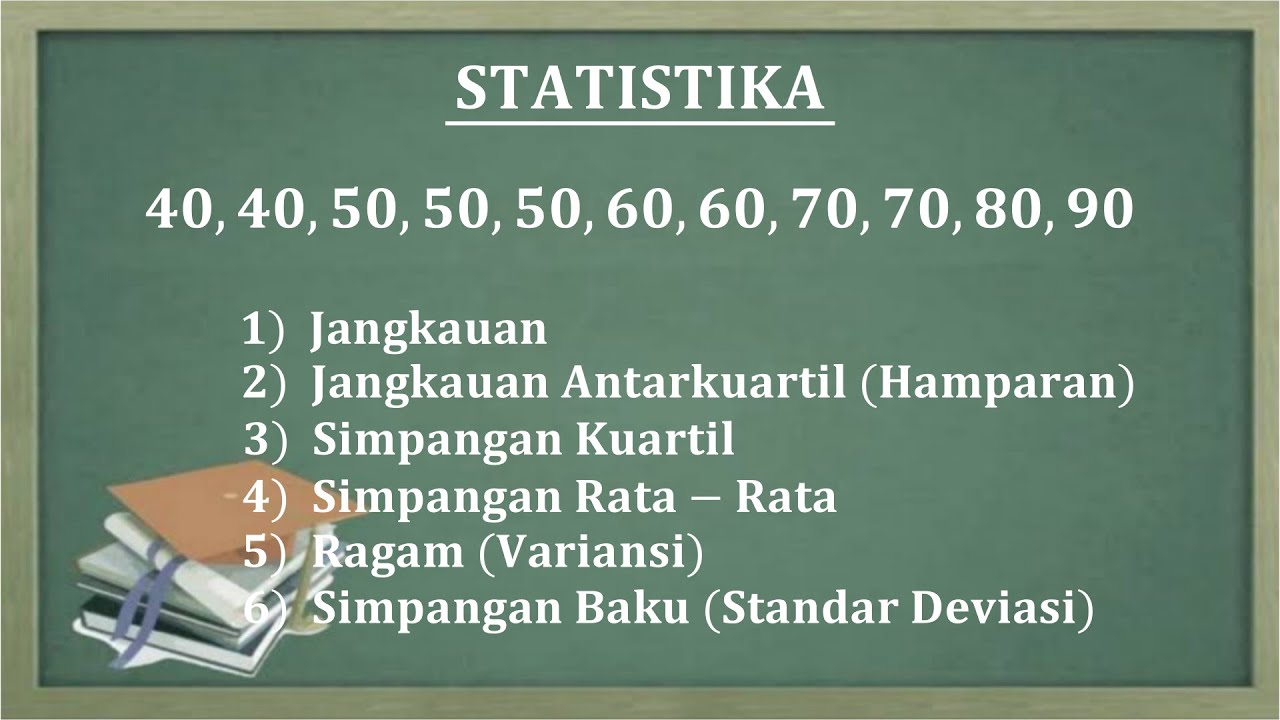
STATISTIKA - Kuartil, Jangkauan, Jangkauan Antar Kuartil Dan Simpangan Kuartil Data Tunggal
Summary
TLDRIn this tutorial, the presenter explains how to calculate quartiles, range, interquartile range, and quartile deviation for a given data set. The video covers step-by-step methods for determining Quartile 1, Quartile 2, Quartile 3, the range between the highest and lowest values, and the interquartile range. Using clear examples, the presenter walks through the formulas and calculations, including the use of interpolation when needed. The video aims to simplify these statistical concepts, making them easy to understand and apply to single data sets, with a focus on practical, real-world application.
Takeaways
- 😀 Quartiles divide a data set into four equal parts, each containing 25% of the data.
- 😀 To find the first quartile (Q1), use the formula: Q1 = (1 * (n + 1)) / 4, where 'n' is the total number of data points.
- 😀 To calculate Q1, sort the data from smallest to largest and then apply the formula to find the position.
- 😀 For Q1, if the result is a decimal, use interpolation to find the exact value between two data points.
- 😀 The second quartile (Q2) is the median of the data set. Use the formula: Q2 = (2 * (n + 1)) / 4.
- 😀 The third quartile (Q3) is calculated similarly to Q1 but for the upper half of the data, with the formula: Q3 = (3 * (n + 1)) / 4.
- 😀 When calculating Q3, use interpolation if the position is a decimal, just like for Q1.
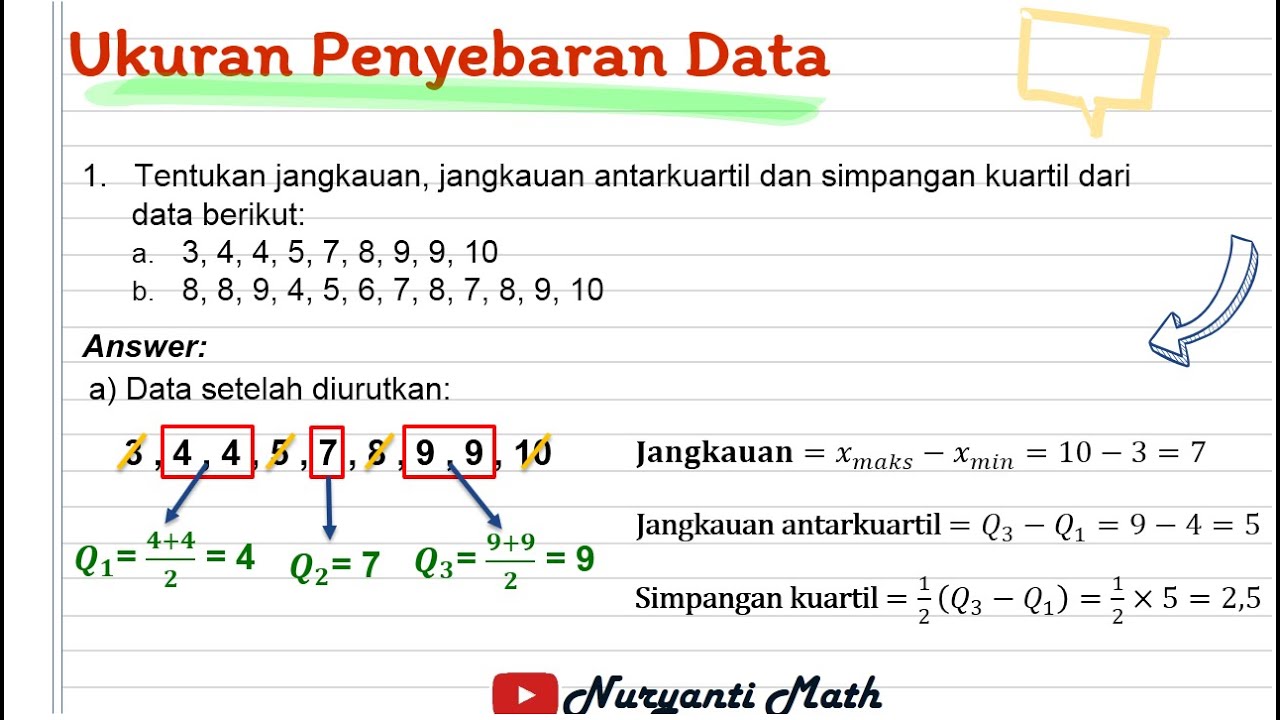
- 😀 The range of a data set is calculated by subtracting the minimum value from the maximum value.
- 😀 The interquartile range (IQR) is the difference between Q3 and Q1 and represents the spread of the middle 50% of the data.
- 😀 The quartile deviation (QD) is half of the IQR, providing a measure of the spread of the data within the middle 50%.
- 😀 Always ensure to check if interpolation is needed when dealing with non-integer positions for quartiles.
Q & A
What is the main topic of the video tutorial?
-The main topic of the video is about calculating statistical measures such as quartiles (Q1, Q2, Q3), interquartile range (IQR), and quartile deviation (QD) for a single dataset.
What is the formula used to calculate the first quartile (Q1)?
-The formula to calculate the first quartile (Q1) is: Q1 = (1 * (n + 1)) / 4, where 'n' is the number of data points in the dataset.
How is interpolation applied when calculating quartiles?
-Interpolation is applied when the result of the quartile calculation is not an integer. It involves finding the weighted average of the values in the dataset that are closest to the calculated position.
How do you calculate the second quartile (Q2)?
-The second quartile (Q2) is calculated using the formula: Q2 = (2 * (n + 1)) / 4. This formula is applied in a similar manner to Q1, but with a factor of 2 instead of 1.
What is the difference between Q1, Q2, and Q3?
-Q1, Q2, and Q3 represent the first, second, and third quartiles of a dataset, respectively. Q1 is the median of the lower half, Q2 is the median of the entire dataset, and Q3 is the median of the upper half of the data.
How is the interquartile range (IQR) calculated?
-The interquartile range (IQR) is calculated by subtracting Q1 from Q3: IQR = Q3 - Q1.
What is the formula for calculating the quartile deviation (QD)?
-The quartile deviation (QD) is calculated using the formula: QD = 1/2 * (Q3 - Q1), which is half of the interquartile range.
Why is it important to order the data before calculating the quartiles?
-It is important to order the data from smallest to largest to ensure the correct positioning of data points when calculating quartiles. This ordered data ensures that the quartiles represent the correct cut-off points.
What is the significance of Q2 (the second quartile) in a dataset?
-Q2 represents the median of the dataset, which divides the data into two equal halves. It provides a central tendency measure of the dataset.
Can you calculate quartiles directly from unsorted data?
-No, you must first sort the data from smallest to largest. Quartiles are based on the ordered dataset, so sorting is essential for accurate calculation.
Outlines

Cette section est réservée aux utilisateurs payants. Améliorez votre compte pour accéder à cette section.
Améliorer maintenantMindmap

Cette section est réservée aux utilisateurs payants. Améliorez votre compte pour accéder à cette section.
Améliorer maintenantKeywords

Cette section est réservée aux utilisateurs payants. Améliorez votre compte pour accéder à cette section.
Améliorer maintenantHighlights

Cette section est réservée aux utilisateurs payants. Améliorez votre compte pour accéder à cette section.
Améliorer maintenantTranscripts

Cette section est réservée aux utilisateurs payants. Améliorez votre compte pour accéder à cette section.
Améliorer maintenantVoir Plus de Vidéos Connexes

Ukuran Penyebaran Data | Statistika Kelas 8

STATISTIKA - Cara mudah menentukan nilai Jangkauan, Jangkauan antarkuartil dan Simpangan kuartil
Ukuran Penyebaran Data (Jangkauan, Jangkauan Antarkuartil, Simpangan Kuartil) - STATISTIKA Kelas 8

Interquartile Range (IQR) | Math with Mr. J
JANGKAUAN, HAMPARAN, SIMPANGAN KUARTIL, SIMPANGAN RATA RATA, RAGAM DAN STANDAR DEVIASI

STATISTIKA Part 2- Jangkauan, Kuartil dan Jangkauan interkuartil
5.0 / 5 (0 votes)
