Video Tutorial Cara Uji Chi Square/Chi Kuadrat dengan Program SPSS
Summary
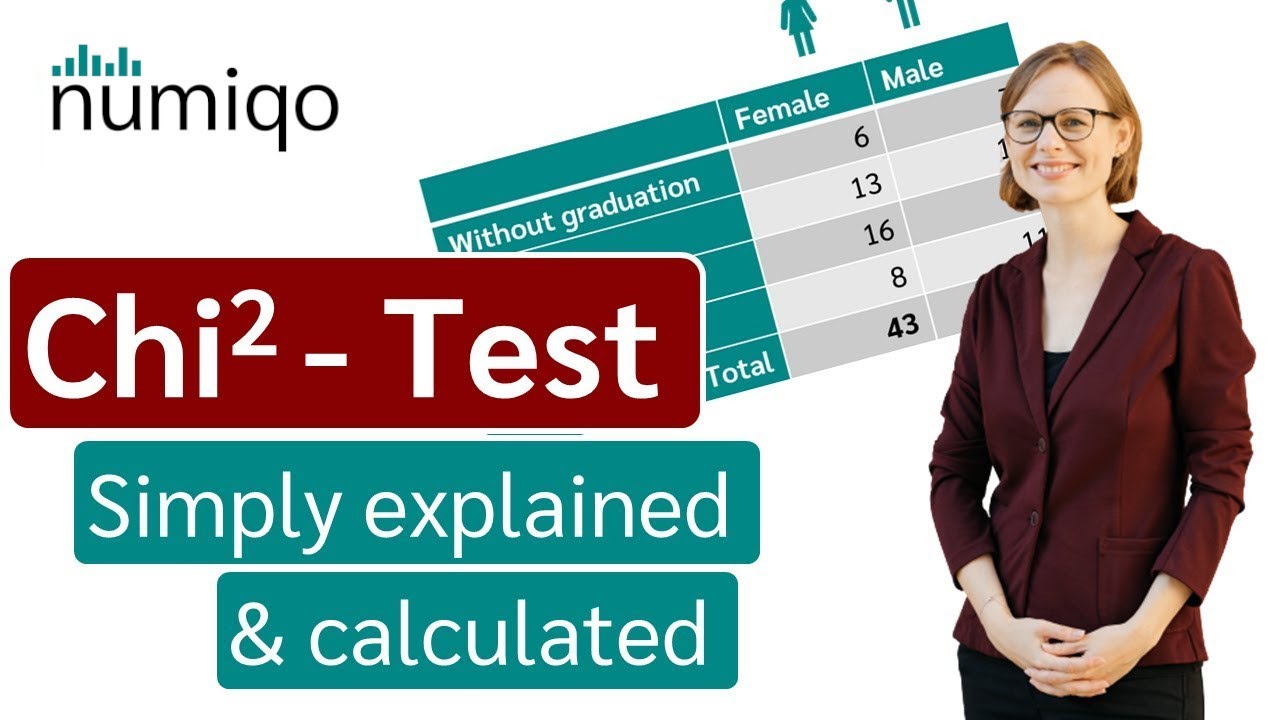
TLDRIn this tutorial, viewers learn how to perform a chi-square test using SPSS to analyze the relationship between two categorical variables: gender and education level. The process involves entering data into SPSS, performing a crosstab analysis, and interpreting the chi-square test results. With an example dataset of 33 respondents, the test reveals no significant relationship between gender and education level, as the p-value exceeds the threshold of 0.05. The video provides clear, step-by-step guidance, making it easy for users to apply the chi-square test in their own research.
Takeaways
- 😀 The Chi-Square test helps analyze the relationship between categorical variables (e.g., gender and education level).
- 😀 The Chi-Square test is typically used with frequency or categorical data such as gender, education level, etc.
- 😀 Categorical data refers to characteristics like gender, education, and nationality, which are described by words rather than numbers.
- 😀 In the example, the researcher examines whether there's a significant relationship between a person’s gender and their education level.
- 😀 The dataset includes 33 samples, with gender and education codes used for analysis (1 for male, 2 for female, 1 for high school, 2 for diploma, etc.).
- 😀 The SPSS program is used for data entry, analysis, and generating Chi-Square test results.
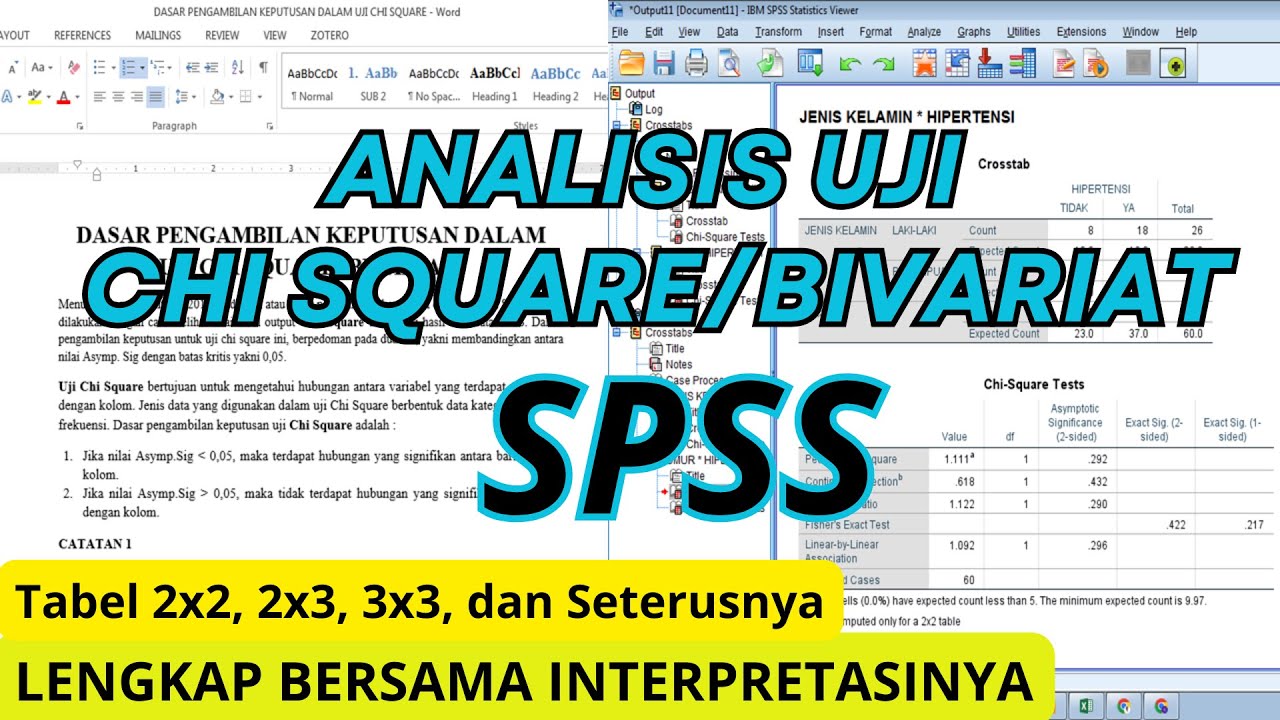
- 😀 The Chi-Square test is conducted by first inputting data into SPSS, and then running an analysis through 'Descriptive Statistics' and 'Crosstabs'.
- 😀 The crosstabulation table in SPSS helps visualize the relationship between gender and education levels.
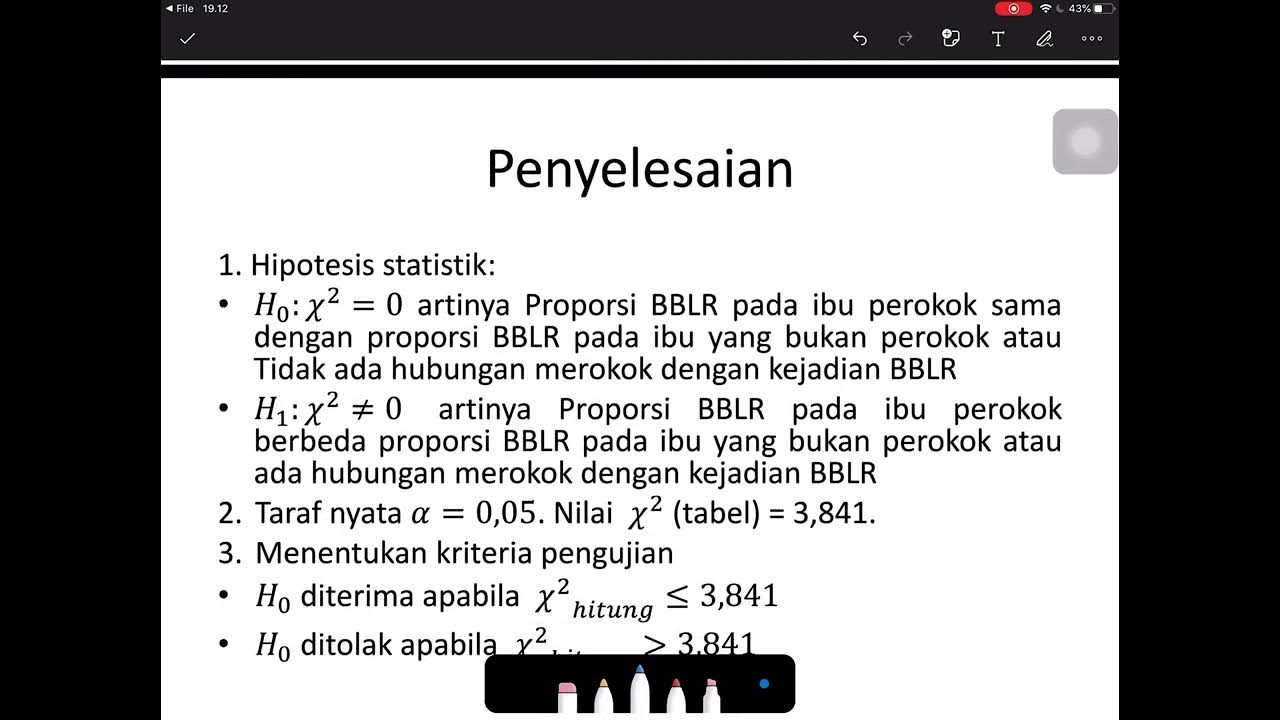
- 😀 In decision-making, the Chi-Square value of 0.584 is compared to the significance threshold of 0.05. Since 0.584 > 0.05, there is no significant relationship.
- 😀 The final conclusion from the test is that there is no significant relationship between gender and education level in this dataset.
- 😀 The video explains how to conduct a Chi-Square test in SPSS, from data entry to interpretation of results, emphasizing the importance of correct data input.
Q & A
What is the main purpose of the chi-square test discussed in the video?
-The main purpose of the chi-square test is to determine whether there is a significant relationship between two categorical variables, such as gender and education level in the example provided.
What type of data is used in a chi-square test?
-The chi-square test uses categorical data, also known as frequency data. This includes data that describes characteristics, such as gender, education level, or nationality.
What is categorical data, and can you provide examples?
-Categorical data refers to data that describes characteristics or attributes. Examples include gender (male, female), level of education (high school, diploma, S1, S2), or nationality.
What is the research case discussed in the video?
-The case study involves a researcher who wants to determine whether there is a relationship between a person's gender and their level of education. The data used in the study consists of 33 individuals, with information on their gender and education level.
How are the gender and education variables coded in the study?
-In the study, gender is coded with '1' for male and '2' for female. Education levels are coded as '1' for high school, '2' for diploma, '3' for S1 (undergraduate), and '4' for S2 (graduate).
How is data entered into SPSS for the chi-square test?
-In SPSS, data is first input into the 'Variable View' section, where variables like gender and education are defined. Then, in the 'Data View' section, the actual data (coded numbers) is entered for each participant.
What is the purpose of the 'Crosstabulation' in SPSS?
-Crosstabulation is used to display the relationship between two categorical variables. In the chi-square test, it shows how the different categories of one variable (e.g., gender) are distributed across the categories of another variable (e.g., education level).
What does the significance value in a chi-square test indicate?
-The significance value in a chi-square test indicates whether the relationship between the variables is statistically significant. If the p-value is greater than 0.05, it suggests no significant relationship. In the video, the p-value is 0.584, which means there is no significant relationship between gender and education level.
What conclusion can be drawn from the chi-square test result in the video?
-Based on the chi-square test result with a significance value of 0.584, we conclude that there is no significant relationship between gender and the level of education in the sample studied.
What steps are involved in performing the chi-square test in SPSS?
-The steps include: 1) Entering data into SPSS, 2) Going to 'Descriptive Statistics' and selecting 'Crosstabs', 3) Assigning variables (gender and education) to rows and columns, 4) Running the chi-square test, and 5) Analyzing the output to check the significance level.
Outlines

Cette section est réservée aux utilisateurs payants. Améliorez votre compte pour accéder à cette section.
Améliorer maintenantMindmap

Cette section est réservée aux utilisateurs payants. Améliorez votre compte pour accéder à cette section.
Améliorer maintenantKeywords

Cette section est réservée aux utilisateurs payants. Améliorez votre compte pour accéder à cette section.
Améliorer maintenantHighlights

Cette section est réservée aux utilisateurs payants. Améliorez votre compte pour accéder à cette section.
Améliorer maintenantTranscripts

Cette section est réservée aux utilisateurs payants. Améliorez votre compte pour accéder à cette section.
Améliorer maintenantVoir Plus de Vidéos Connexes


5.0 / 5 (0 votes)
