Where Will NVIDIA Bottom? - NVDA Stock, SPY, QQQ Update
Summary
TLDRIn this Nvidia daily update, the analyst discusses the stock's recent performance, highlighting its underperformance compared to the broader market. Despite some market stability, Nvidia has continued to weaken, with lower lows and lower highs, signaling a potential bearish trend. The analyst points to key technical indicators, such as the MACD and Fibonacci levels, suggesting further downside to a target around $150. While the market shows mixed bullish and bearish signals, the focus remains on Nvidia's struggle and the possibility of a larger correction. The video offers in-depth technical insights, stressing caution and patience for future movements.
Takeaways
- 😀 Nvidia has been significantly underperforming the broader market, continuing its downward trend despite a generally positive market environment.
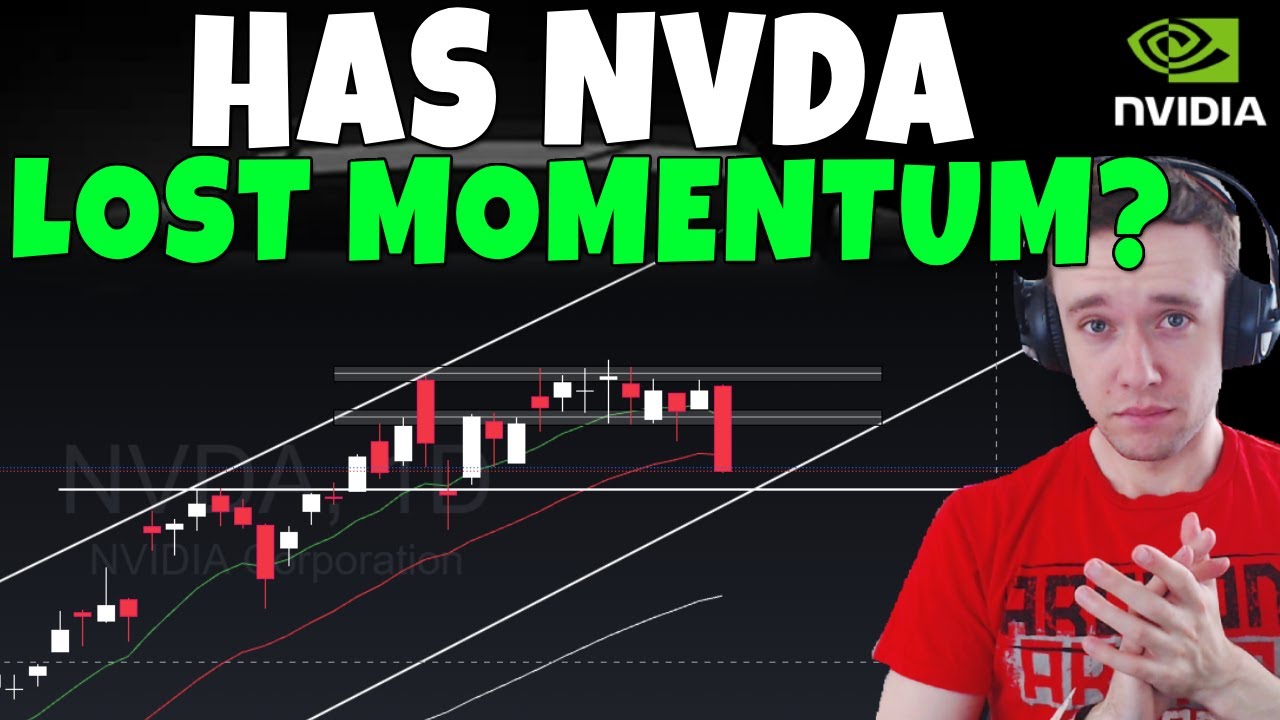
- 📉 The stock's momentum has weakened, showing lower lows and lower highs, and failing to regain critical support levels.
- 🔮 The speaker previously warned about Nvidia's rally being a 'trap,' and this analysis has proven to be accurate, as the stock continues to decline.
- 💥 Nvidia's price is currently testing critical support levels, with the 169-170 zone being pivotal for potential recovery or further decline.
- 🚨 A breakdown below 169 could signal the beginning of a larger move downwards, with 150 being the primary downside target for the stock.
- 📉 The MACD indicator showed signs of overextension during the rally, suggesting a high probability of a bearish divergence, which has materialized in the stock's performance.
- 🔥 The broader market, including the QQQ and SPY ETFs, is showing signs of bearish divergence, with price rising but the MACD trending lower, suggesting a potential consolidation or dip.
- 🔍 While the market isn't expected to crash, the speaker anticipates a retest of previous all-time highs, particularly around the low 600s for SPY and mid-500s for QQQ.
- 💡 The potential for a 'Santa Claus rally' in the final months of the year is discussed, with historical trends suggesting a shift toward bullishness in November-December.
- 📈 The speaker's options analysis for Nvidia shows mixed flow, with some bullish and bearish bets coming in, but no clear consensus on the stock's immediate direction.
- 📝 Overall, the speaker remains cautious on Nvidia, not fully convinced of a bullish reversal despite some buying interest, and recommends waiting for further confirmation.
Q & A
What is the general market trend for Nvidia, according to the analysis?
-Nvidia is underperforming compared to the broader market, showing signs of weakness, with lower lows and lower highs. The stock has been consolidating at a lower level and has not seen significant upward movement despite a generally positive market trend.
What is the significance of the MACD in this analysis of Nvidia?
-The MACD is used to highlight overextended market conditions. In the case of Nvidia, the MACD was elevated to historically high levels, suggesting that the stock was due for a pullback. The analysis cautions that such elevated levels often lead to bearish divergences or corrections.
What specific levels does the analyst focus on for Nvidia's performance?
-The analyst highlights the 169-170 price range as a key level to watch. If Nvidia can reclaim this level, it could signal a potential reversal or bear trap. If the stock fails to reclaim this range, the downside risk remains, with the next target being around $150.
How does the analyst view Nvidia's recent price action?
-The analyst views Nvidia's recent price action as weak, with the stock failing to bounce significantly despite a relatively stable broader market. This suggests that the stock is likely to continue its downward trajectory unless the bulls step in quickly.
What is the analyst’s primary target for Nvidia’s price in the short term?
-The primary target for Nvidia's price in the short term is a retest of the $150 mark, where the stock could revisit previous all-time highs and the 38.2% Fibonacci retracement level.
What is a bear flag, and why does the analyst expect it for Nvidia?
-A bear flag is a chart pattern where the price consolidates after a sharp decline, only to continue downward after a brief upward movement. The analyst expects Nvidia to form a bear flag due to its weak price action and technical indicators suggesting further downside.
What does the analyst expect to happen to the broader market in the coming weeks?
-The analyst anticipates potential consolidation or a pullback in the broader market. This could manifest as a retest of previous all-time highs for both the SPY and QQQ ETFs. However, the market is expected to remain generally bullish in the long term, with a possible 'Santa Claus rally' toward the end of the year.
What role does the RSI (Relative Strength Index) play in this analysis?
-While the RSI can indicate overbought or oversold conditions, the analyst places more emphasis on the MACD for detecting overextension. The RSI is mentioned as a supporting tool, but it is not the primary indicator for predicting potential pullbacks in Nvidia’s stock.
Why does the analyst remain cautious about taking long positions in Nvidia?
-The analyst remains cautious because Nvidia's technical indicators, particularly the MACD and price action, suggest a bearish continuation. The risk to the downside is still prevalent, and while there are potential opportunities in options like cash puts, outright long positions are considered too risky.
What is the significance of options flow for Nvidia in this analysis?
-The options flow is mixed, with both bullish and bearish sentiment being observed. While some investors are buying calls, the analyst does not see any extraordinary signs in the options market that would indicate a clear bullish or bearish shift. This adds to the uncertainty regarding Nvidia’s short-term price movement.
Outlines

Cette section est réservée aux utilisateurs payants. Améliorez votre compte pour accéder à cette section.
Améliorer maintenantMindmap

Cette section est réservée aux utilisateurs payants. Améliorez votre compte pour accéder à cette section.
Améliorer maintenantKeywords

Cette section est réservée aux utilisateurs payants. Améliorez votre compte pour accéder à cette section.
Améliorer maintenantHighlights

Cette section est réservée aux utilisateurs payants. Améliorez votre compte pour accéder à cette section.
Améliorer maintenantTranscripts

Cette section est réservée aux utilisateurs payants. Améliorez votre compte pour accéder à cette section.
Améliorer maintenant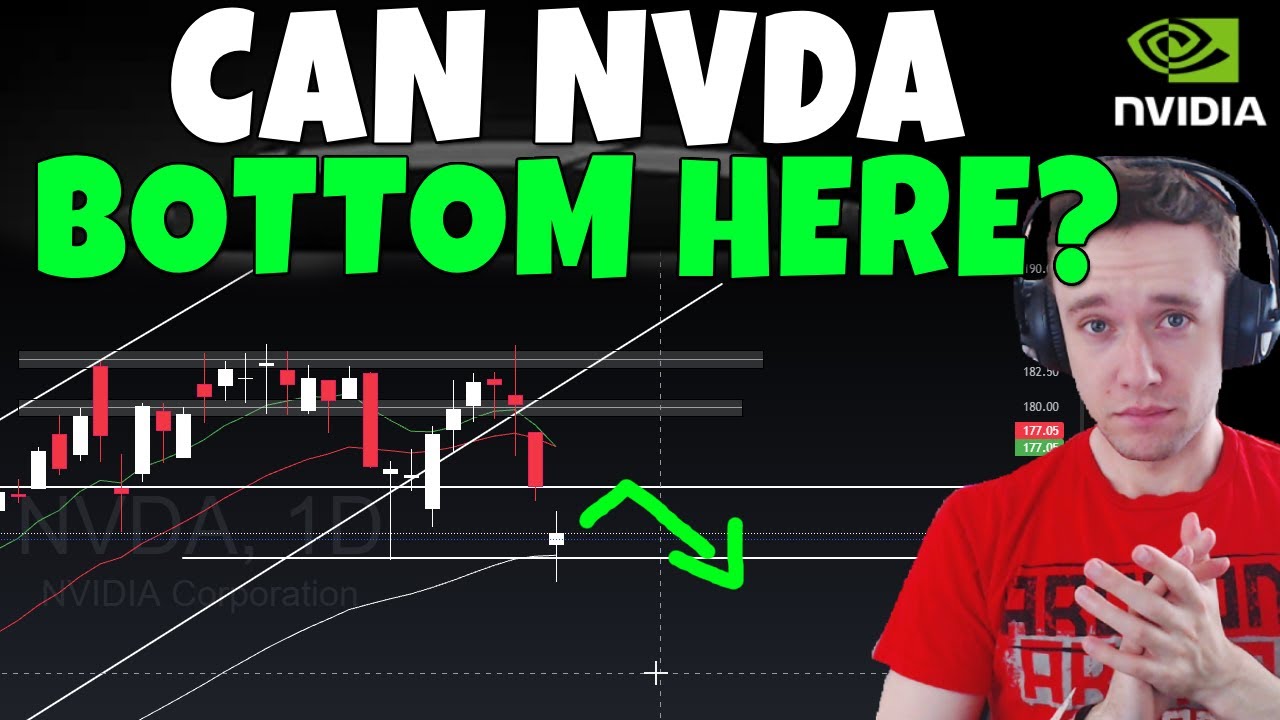


5.0 / 5 (0 votes)
