Graphing Inverse Functions
Summary
TLDRThis lesson focuses on graphing inverse functions. It explains how the inverse function is a reflection of the original function across the line y = x. The video guides viewers through various examples, demonstrating how to sketch inverse functions both visually and using coordinate points. It emphasizes the importance of symmetry between a function and its inverse, showing how to plot inverse points by switching x and y values. The video is a practical guide for understanding and graphing inverse functions using basic graphical techniques.
Takeaways
- 😀 The inverse function is the reflection of a given function across the line y = x.
- 😀 To graph the inverse function, start by drawing the line y = x, then reflect the graph of the original function across it.
- 😀 The inverse function is symmetric about the line y = x.
- 😀 For simple cases, a rough sketch of the inverse can be done using visual reflection over the line y = x.
- 😀 When graphing an inverse, plotting key points and switching their x and y coordinates can help generate an accurate graph.
- 😀 The inverse of a function is determined by swapping the x and y values of the function's points.
- 😀 The graph of the inverse function maintains an equal distance from the line y = x as the original function.
- 😀 It's crucial to plot the points of the original function in a table, then swap the x and y values to create the inverse function's points.
- 😀 The points of the inverse function can be plotted one at a time, connecting them as you go to create a clear graph.
- 😀 Graphing the inverse function involves ensuring symmetry between the original and inverse graphs, confirmed by equal distances from the line y = x.
Q & A
What is the main focus of this lesson?
-The main focus of this lesson is graphing the inverse function and understanding its graphical relationship with the original function.
How do you graph the inverse function of a given function?
-To graph the inverse function, first draw the line y = x. Then, reflect the graph of the original function across this line to get the graph of the inverse function.
What does the inverse function represent graphically?
-The inverse function is a reflection of the original function across the line y = x. The graph of the inverse function is symmetric about this line.
Why is the line y = x important when graphing the inverse function?
-The line y = x serves as the axis of symmetry for the graph of the inverse function. The original function and its inverse are reflections of each other across this line.
How can you graph the inverse function using points?
-To graph the inverse function using points, you can swap the x and y coordinates of the points of the original function. After switching the coordinates, plot the new points on the graph.
What is the relationship between the points of a function and its inverse?
-The points of a function and its inverse are related by swapping the x and y coordinates. For example, if a point on the original function is (x, y), the corresponding point on the inverse function will be (y, x).
In the examples provided, what was the first step in graphing the inverse function?
-The first step in graphing the inverse function was drawing the line y = x, which is the axis of symmetry for the function and its inverse.
What happens if the function starts on the negative x-axis when graphing its inverse?
-If the function starts on the negative x-axis, its inverse will start from the negative y-axis, and the graph will reflect across the line y = x.
How do you ensure accuracy when graphing the inverse function using points?
-To ensure accuracy, it is important to carefully switch the x and y coordinates for each point of the original function. Plot the new points in order and connect them smoothly to form the inverse function.
Why is it important to be careful with the points when graphing the inverse function?
-Being careful with the points is crucial because any error in switching the coordinates will result in an incorrect graph of the inverse function.
Outlines

Cette section est réservée aux utilisateurs payants. Améliorez votre compte pour accéder à cette section.
Améliorer maintenantMindmap

Cette section est réservée aux utilisateurs payants. Améliorez votre compte pour accéder à cette section.
Améliorer maintenantKeywords

Cette section est réservée aux utilisateurs payants. Améliorez votre compte pour accéder à cette section.
Améliorer maintenantHighlights

Cette section est réservée aux utilisateurs payants. Améliorez votre compte pour accéder à cette section.
Améliorer maintenantTranscripts

Cette section est réservée aux utilisateurs payants. Améliorez votre compte pour accéder à cette section.
Améliorer maintenantVoir Plus de Vidéos Connexes
Komposisi Fungsi Part 3 - Fungsi invers dan Sifat-sifatnya [ Matematika Wajib Kelas X ]
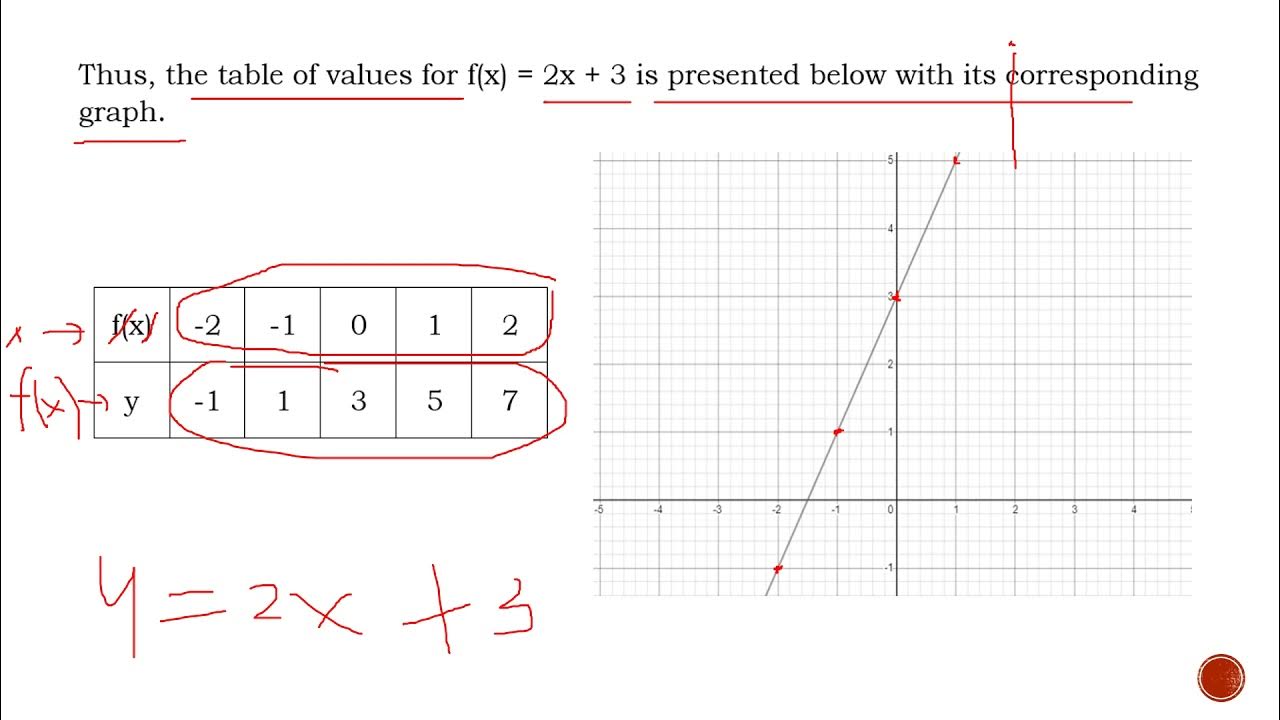
REPRESENTATIONS OF AN INVERSE FUNCTIONS | General Mathematics | Quarter 1 - Module 13
(Part 1) FUNGSI KOMPOSISI DAN FUNGSI INVERS MATEMATIKA SMA KELAS 11 #kurikulummerdeka #matematikasma

FUNGSI INVERS KELAS 11, KONSEP DAN CONTOH SOAL mudah dipahami
Representations of Rational Function

Grade 10 - Illustrating and graphing polynomial functions | SirABC
5.0 / 5 (0 votes)
