*SIMPLEST* Standard Deviation Video You Will Watch - ICT Concepts
Summary
TLDRIn this video, the speaker explains their unique approach to using standard deviations in trading. Unlike traditional methods, they apply these deviations after analyzing market structure and identifying manipulation legs. The speaker emphasizes the importance of liquidity zones and using confluence between standard deviations and these zones to make better trade decisions. By prioritizing liquidity and combining it with specific Fibonacci levels, they demonstrate how to refine entries and exits in trades, offering a practical and intuitive method that avoids overcomplicating the analysis process. Overall, it's a strategy designed to help traders enhance their decision-making and confidence.
Takeaways
- 😀 Daily live streams are available; use the link in the description to watch them every day.
- 😀 The speaker offers a discount for prop firm accounts, using a specific code to get 71% off.
- 😀 Standard deviations are used after confirming the trade setup; the speaker prioritizes analysis before adding standard deviations into the mix.
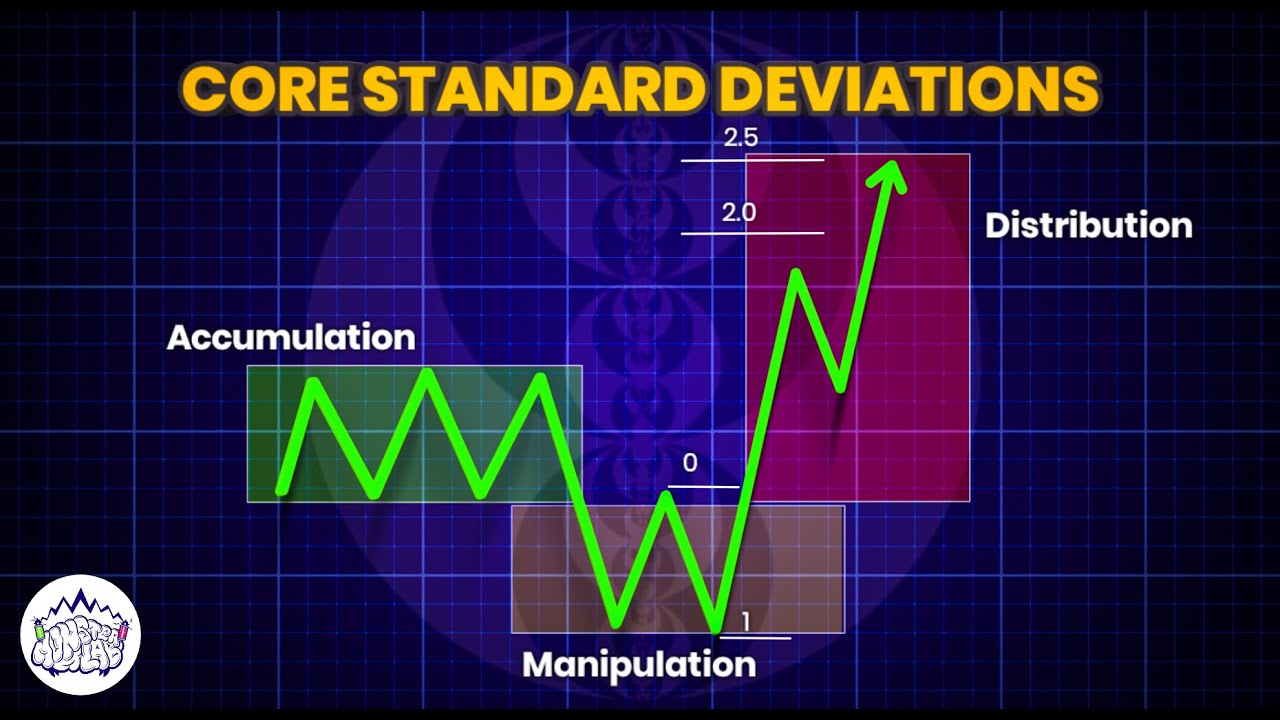
- 😀 The concept of manipulation legs is introduced: these are market moves that break previous structure highs or lows.
- 😀 To use standard deviations, focus on the manipulation leg, which is defined as the leg that breaks a low to make a new high (or vice versa).
- 😀 Standard deviation levels like -2.5, -4, and N-4 are used to find key zones for targets, but the primary focus is liquidity alignment.
- 😀 Liquidity matching with standard deviation zones increases confidence in holding positions and exiting at more favorable points.
- 😀 The speaker recommends using the standard deviation levels to confirm a trade but not to base the entire analysis solely on them.
- 😀 In the speaker's method, liquidity points are prioritized over strict Fibonacci standard deviation targets when deciding on where to exit positions.
- 😀 The analysis should be done before using standard deviations to avoid analysis paralysis and to ensure the trade's integrity is maintained.
Q & A
What is the speaker's primary focus in this video?
-The speaker is explaining how they use standard deviations in their trading strategy, specifically within the context of market structure shifts and liquidity. They also provide a personalized method for drawing and applying standard deviations in trading.
What does the speaker mean by 'manipulation leg' in the market?
-A manipulation leg is a price movement that either breaks a key low or high, indicating a shift in market direction. This leg is essential for drawing standard deviations and understanding potential market reversals.
How does the speaker draw standard deviations on the chart?
-The speaker draws standard deviations based on the manipulation leg. They start from the low to the high of the manipulation leg and then apply a set of Fibonacci levels (0, 0.5, -1, 1.5, -2, etc.) to map the standard deviation.
What is the significance of liquidity in relation to standard deviations?
-Liquidity is a crucial factor for the speaker in determining where to hold a position. They use standard deviations in conjunction with liquidity zones, particularly looking for confluence where standard deviation levels match key liquidity points.
Why does the speaker prioritize liquidity over standard deviations?
-The speaker prioritizes liquidity because it represents real market interest, and matching standard deviations with liquidity zones provides more confidence in holding positions longer. Standard deviations alone might not be sufficient without this confirmation.
What does the speaker recommend for traders using standard deviations?
-The speaker recommends understanding the market structure first and entering a trade based on their own analysis, using standard deviations only after the trade is confirmed. This avoids 'analysis paralysis' and ensures the trader is focused on the trade setup.
How does the speaker use the Fibonacci levels in their trading strategy?
-The speaker uses specific Fibonacci levels, such as -2, -2.5, and 4, to identify possible price reversal or continuation zones. These levels are applied in conjunction with liquidity points to improve the accuracy of their trade entries and exits.
What is the purpose of using a line chart when drawing standard deviations?
-The speaker uses a line chart to visualize the price structure more clearly, as it removes the noise caused by candles and helps in identifying manipulation legs. This makes it easier to draw and apply standard deviations based on the market's movement.
What does the speaker mean by 'holding a runner' in trading?
-Holding a runner refers to keeping a portion of the trade open to capture additional profit after the initial target has been reached, especially if the price moves in a favorable direction and aligns with liquidity or standard deviation levels.
What does the speaker say about drawing standard deviations for a 'failed swing'?
-The speaker mentions that even in cases of a failed swing (where the price doesn't reach the expected level), standard deviations can still be useful. If the manipulation leg and liquidity align, they might hold the trade until the target is reached, but they don't always trust every standard deviation line.
Outlines

Cette section est réservée aux utilisateurs payants. Améliorez votre compte pour accéder à cette section.
Améliorer maintenantMindmap

Cette section est réservée aux utilisateurs payants. Améliorez votre compte pour accéder à cette section.
Améliorer maintenantKeywords

Cette section est réservée aux utilisateurs payants. Améliorez votre compte pour accéder à cette section.
Améliorer maintenantHighlights

Cette section est réservée aux utilisateurs payants. Améliorez votre compte pour accéder à cette section.
Améliorer maintenantTranscripts

Cette section est réservée aux utilisateurs payants. Améliorez votre compte pour accéder à cette section.
Améliorer maintenantVoir Plus de Vidéos Connexes


5.0 / 5 (0 votes)
