Cara Uji Korelasi Dengan SPSS
Summary
TLDRIn this tutorial, Endah demonstrates how to perform a Pearson correlation test using SPSS, guiding users step-by-step through the process. The video covers preparing research data, formulating hypotheses, and inputting data into SPSS. It then walks through conducting the correlation test, interpreting the output, and analyzing the significance and correlation coefficient. Endah emphasizes the importance of the significance value and explains how to compare the results with an R table value to validate findings. By the end, users will understand how to determine the relationship between two variables and interpret their data effectively.
Takeaways
- 😀 The Pearson correlation test in SPSS is used to determine the strength and direction of the relationship between two variables.
- 😀 The script emphasizes the need for SPSS software and research data in Excel format to perform the correlation test.
- 😀 A basic dataset with two variables (X and Y) and a sample size of 35 respondents is used in the example for the test.
- 😀 The hypothesis tested suggests that a higher level of punishment (X) leads to better employee performance (Y).
- 😀 SPSS output for the Pearson correlation test includes the significance value, which is crucial for decision-making.
- 😀 A significance value below 0.05 indicates that the variables are correlated.
- 😀 In cases where significance is unclear, the R-table value can be used to confirm the correlation relationship.
- 😀 The R-table value for a sample size of 35 respondents is 0.2826 for a one-tailed test and 0.3338 for a two-tailed test.
- 😀 The correlation coefficient (0.762) indicates a strong positive relationship between punishment and employee performance.
- 😀 The results suggest that a higher punishment given to employees leads to higher performance, confirming the positive hypothesis.
- 😀 The video concludes with an encouragement to share and subscribe, aiming to help others understand how to conduct a Pearson correlation test using SPSS.
Q & A
What is the main purpose of the Pearson correlation test in this video?
-The main purpose of the Pearson correlation test in this video is to determine the strength and direction of the relationship between two variables, in this case, vanishment and employee performance.
How do you set up the SPSS application for the correlation test?
-To set up SPSS for the correlation test, you first input the research data into the variable view section, naming the variables (e.g., vanishment and employee performance), and then configure the settings such as decimal places and variable types.
What is the significance value in the Pearson correlation test and what does it indicate?
-The significance value indicates whether the relationship between the variables is statistically significant. If the significance value is less than 0.05, it suggests a significant relationship, while a value greater than 0.05 indicates no significant relationship.
Why is it important to determine whether the hypothesis is one-tailed or two-tailed?
-Determining whether the hypothesis is one-tailed or two-tailed is important because it affects the direction of the correlation test. A one-tailed hypothesis suggests a specific direction of the relationship, while a two-tailed hypothesis tests for any relationship, either positive or negative.
What does the R table value represent in the Pearson correlation test?
-The R table value represents a critical value used to compare the correlation coefficient. If the correlation coefficient is greater than the R table value, it indicates a significant relationship between the variables.
How do you interpret the correlation coefficient in this test?
-The correlation coefficient ranges from -1 to +1, with values closer to +1 indicating a strong positive relationship. In this case, a coefficient of 0.762 suggests a strong positive relationship between vanishment and employee performance.
What does the coefficient interval tell you about the relationship between the variables?
-The coefficient interval shows the strength of the relationship. In this case, the value of 0.762 falls within the range of 0.60 to 0.799, indicating a strong relationship between the two variables.
What conclusion can be drawn from the Pearson correlation test in this video?
-The conclusion from the test is that there is a positive and significant relationship between vanishment and employee performance, meaning that as the vanishment increases, employee performance also increases.
How do you perform the correlation test in SPSS after entering the data?
-After entering the data into SPSS, go to the 'Analyze' menu, choose 'Correlate', and then select 'Bivariate'. Choose the variables to analyze, select the 'Pearson' correlation, and set the hypothesis to one-tailed or two-tailed depending on your research hypothesis.
What is the purpose of comparing the correlation value with the R table value?
-The purpose of comparing the correlation value with the R table value is to provide an additional method for determining the significance of the relationship. If the correlation value exceeds the R table value, it confirms a significant relationship between the variables.
Outlines

Cette section est réservée aux utilisateurs payants. Améliorez votre compte pour accéder à cette section.
Améliorer maintenantMindmap

Cette section est réservée aux utilisateurs payants. Améliorez votre compte pour accéder à cette section.
Améliorer maintenantKeywords

Cette section est réservée aux utilisateurs payants. Améliorez votre compte pour accéder à cette section.
Améliorer maintenantHighlights

Cette section est réservée aux utilisateurs payants. Améliorez votre compte pour accéder à cette section.
Améliorer maintenantTranscripts

Cette section est réservée aux utilisateurs payants. Améliorez votre compte pour accéder à cette section.
Améliorer maintenantVoir Plus de Vidéos Connexes

Tutorial Uji Korelasi Pearson dengan SPSS - Cara Uji Korelasi Product Moment
How To Perform A Pearson Correlation Test In Excel
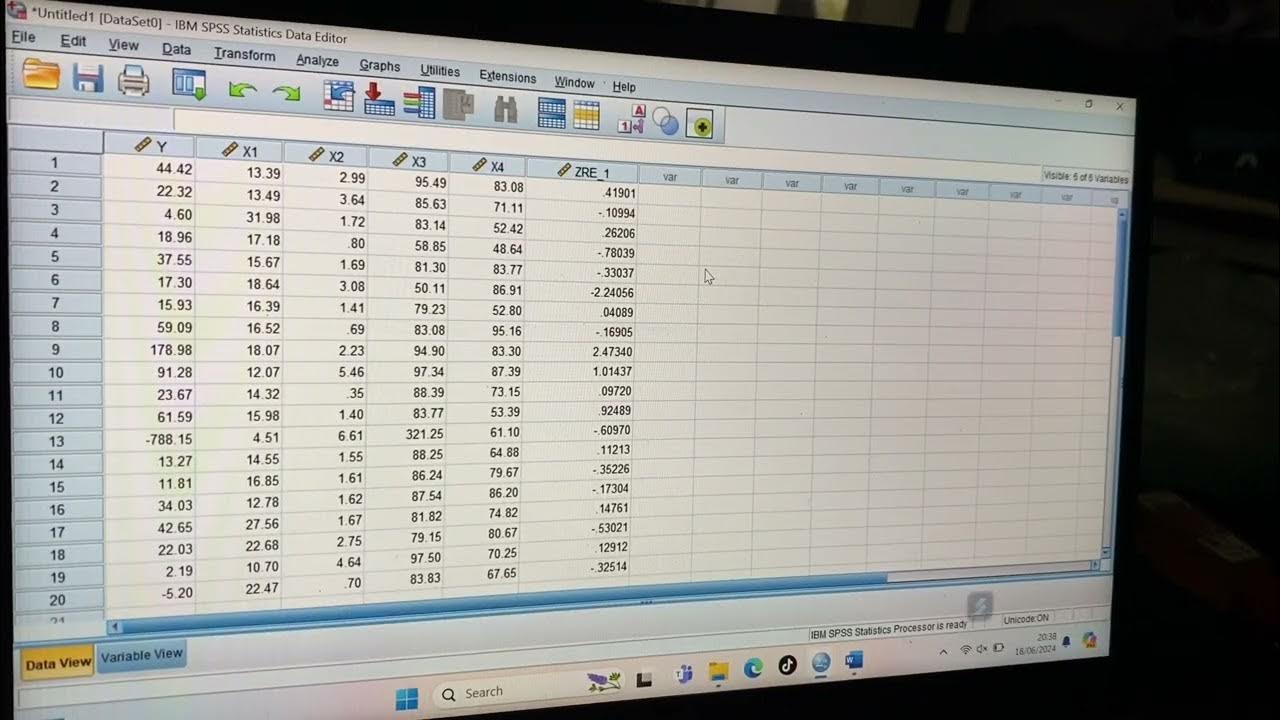
Tutorial Menggunakan Spss untuk data Panel

Uji Regresi Linier Sederhana Dengan SPSS | Pembahasan Lengkap!
Tutorial Analisis Korelasi Pearson dengan SPSS
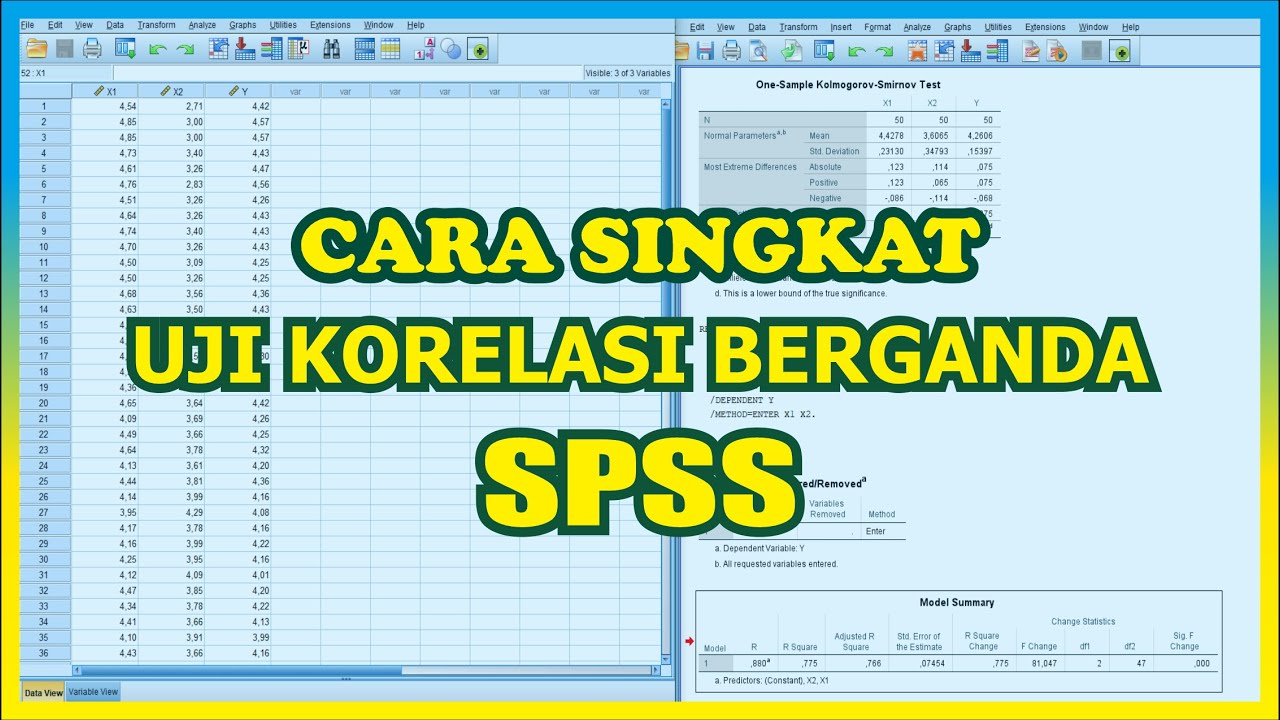
TUTORIAL SPSS : Multiple Correlation Test SPSS
5.0 / 5 (0 votes)
