Building Logistic Regression Models using RapidMiner Studio
Summary
TLDRIn this video, Professor SEL demonstrates how to build a logistic regression classification model using RapidMiner Studio 6.3 Starter Edition. The dataset, collected from Bay State Medical Center, is used to predict low vs. high birth weight based on maternal characteristics. After preprocessing the data, including converting categorical variables to numeric, a logistic regression model is built and evaluated. The accuracy of the model is analyzed using a confusion matrix. The video also explores how adjusting the threshold probability can improve the accuracy of the low birth weight class, making the model more useful for specific business applications.
Takeaways
- 😀 The dataset used in the model consists of 189 examples with 10 attributes related to birth weights and mother characteristics.
- 😀 The target variable, `bwt`, represents birth weight, with two classes: 'low' (<2500g) and 'high' (>2500g).
- 😀 The race variable is a nominal attribute with three possible values (black, white, other), and is converted into dummy variables.
- 😀 The `ID` field in the dataset is excluded from the model as it is not useful for predictions.
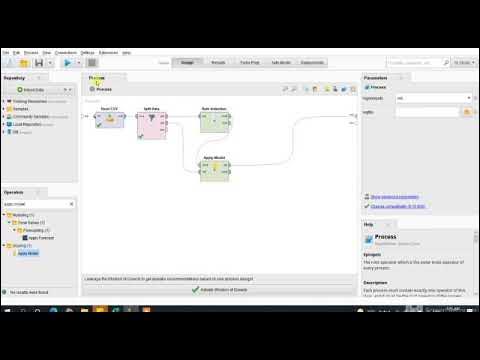
- 😀 A logistic regression model is built using RapidMiner Studio 6.3 Starter Edition to predict birth weight based on various mother characteristics.
- 😀 The model is trained using 70% of the dataset, and its performance is evaluated on the remaining 30% using classification metrics.
- 😀 The classification metrics include accuracy, confusion matrix, and class-specific performance (for both 'low' and 'high' birth weight).
- 😀 The default threshold probability used for classification is 0.5, which determines whether an example is classified as 'low' or 'high'.
- 😀 The accuracy of the 'low' birth weight class was initially around 61.54%, while the overall model accuracy was 59.65%.
- 😀 The threshold probability can be adjusted to prioritize the accuracy of a specific class, such as increasing the accuracy of the 'low' birth weight class to at least 80%.
- 😀 Adjusting the threshold for class prediction results in a trade-off between increasing accuracy for one class while reducing it for the other class and overall accuracy.
Q & A
What is the main objective of the video?
-The main objective of the video is to demonstrate how to build a logistic regression classification model, evaluate it using classification metrics, and improve its accuracy by modifying the cutoff probability using RapidMiner Studio 6.3.
What dataset is used in the video, and where is it from?
-The dataset used in the video is the 'Low Earth Weight' dataset, collected at Bay State Medical Center in Springfield, Massachusetts during 1986. The dataset is copyrighted by John Wy and Son, Incorporated.
What is the target variable in the dataset, and what does it represent?
-The target variable is 'bwt,' which represents the birth weight of babies. It is a binary variable with two classes: 'low' (birth weight less than 2500g) and 'high' (birth weight greater than 2500g).
How does RapidMiner treat the target variable, and why is this significant?
-Although the target variable is binary, RapidMiner treats it as a 'polynom' (polynomial) variable. This distinction is important because the model needs to handle it as a binary variable, despite how it is represented in RapidMiner.
Why is the 'ID' field excluded from the dataset during the pre-processing stage?
-The 'ID' field is excluded because it does not provide any predictive value for the logistic regression model and is therefore irrelevant to the analysis.
What method is used to convert the 'race' variable into a numeric format?
-The 'race' variable, which is categorical with three possible values (black, white, and other), is converted into dummy variables using the 'Nominal to Numeric' operator in RapidMiner.
Why is one of the dummy variables for the 'race' variable removed from the dataset?
-One of the dummy variables for the 'race' variable is removed because it would be perfectly correlated with the remaining two. Removing it helps avoid multicollinearity in the model.
How is the logistic regression model evaluated in the video?
-The logistic regression model is evaluated by splitting the data into two partitions: a training set (70% of the data) and a validation set (30%). The model is then applied to the validation set using the 'Apply Model' operator, and performance is assessed using the 'Performance Classification' operator.
What does the confusion matrix in the performance output show?
-The confusion matrix shows the accuracy of predictions for each class (low and high birth weight), as well as the overall accuracy of the model. It includes both true positive and misclassified predictions.
How can the accuracy of one class (e.g., low birth weight) be improved in the model?
-The accuracy of one class can be improved by adjusting the cutoff probability used to classify instances. By lowering the threshold for the low birth weight class, the model will categorize more instances as low birth weight, increasing its accuracy for that class.
What happens to the overall accuracy when the cutoff probability is changed to favor one class?
-When the cutoff probability is adjusted to favor one class, such as increasing the threshold for the high birth weight class, the accuracy for the favored class improves, but this often leads to a decrease in the accuracy for the other class and a reduction in overall model accuracy.
What threshold value is used in the video to achieve at least 80% accuracy for the low birth weight class?
-In the video, the cutoff probability is adjusted from 0.5 to 0.6 and eventually to 0.7 in order to achieve at least 80% accuracy for the low birth weight class.
Why is it important to evaluate the accuracy of each class individually in a classification model?
-Evaluating the accuracy of each class individually is important because, in some cases, the class imbalance might lead to one class being predicted very accurately while the other class has low accuracy, which could affect the overall effectiveness of the model in specific business contexts.
Outlines

Cette section est réservée aux utilisateurs payants. Améliorez votre compte pour accéder à cette section.
Améliorer maintenantMindmap

Cette section est réservée aux utilisateurs payants. Améliorez votre compte pour accéder à cette section.
Améliorer maintenantKeywords

Cette section est réservée aux utilisateurs payants. Améliorez votre compte pour accéder à cette section.
Améliorer maintenantHighlights

Cette section est réservée aux utilisateurs payants. Améliorez votre compte pour accéder à cette section.
Améliorer maintenantTranscripts

Cette section est réservée aux utilisateurs payants. Améliorez votre compte pour accéder à cette section.
Améliorer maintenantVoir Plus de Vidéos Connexes

Logistic Regression Using Excel
Machine Learning Tutorial Python - 8: Logistic Regression (Binary Classification)

3. Learning untuk Klasifikasi dari MACHINE LEARNING

Lec-5: Logistic Regression with Simplest & Easiest Example | Machine Learning
RapidMiner - Klasifikasi Iris
Regresi Ordinal dan Multinomial Logistik Pada Data Crosssection dengan Minitab
5.0 / 5 (0 votes)
