Chi-Square Tests: Crash Course Statistics #29
Summary
TLDRIn this video, Adriene Hill introduces chi-square tests, explaining how they help assess the fit between categorical data and expected distributions. Through examples like the popular game League of Lemurs and the NerdFighteria Survey, she walks viewers through the process of conducting chi-square Goodness of Fit tests, Tests of Independence, and Tests of Homogeneity. The video explores how these tests evaluate categorical variables such as game character types and Hogwarts house preferences. Hill also emphasizes the importance of assumptions, expected frequencies, and how to calculate chi-square statistics to make informed decisions about data relationships.
Takeaways
- 😀 Statistics help us assess whether our models or expectations fit the data we have.
- 😀 Chi-square tests are used to compare observed data to expected data for categorical variables.
- 😀 A chi-square test can be applied to categorical variables like hair color, academic degree, or tax bracket.
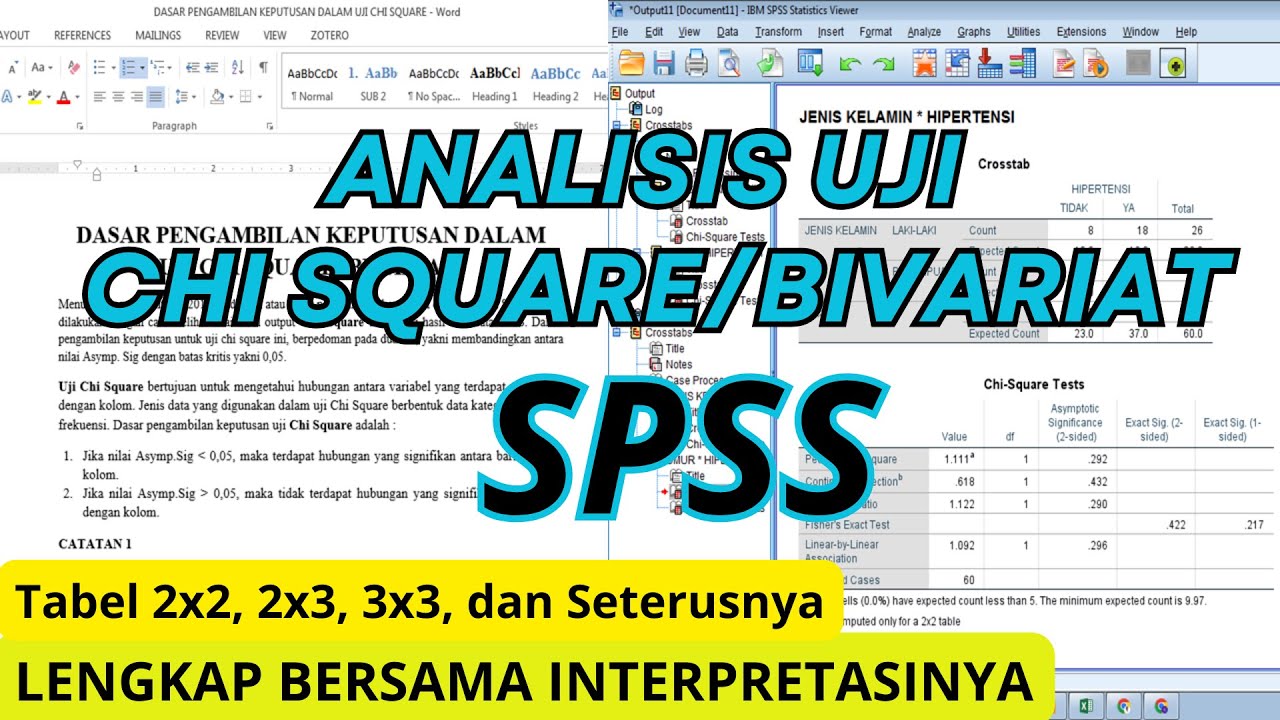
- 😀 Contingency tables (or cross-tabulations) help analyze the relationship between two categorical variables.
- 😀 Chi-square goodness of fit tests assess how well a sample fits a given distribution.
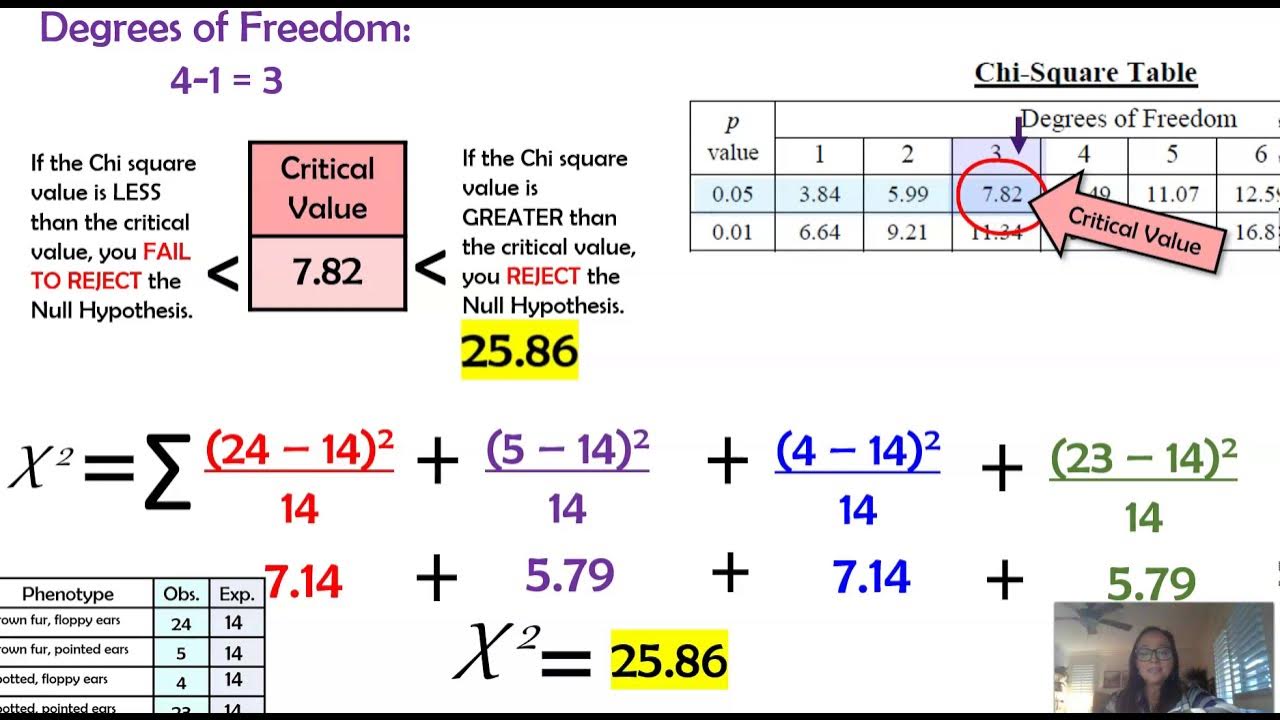
- 😀 The chi-square statistic is calculated by comparing the observed frequency to the expected frequency.
- 😀 In a chi-square test, differences are squared to ensure that both positive and negative differences are treated equally.
- 😀 Chi-square tests have degrees of freedom, which are determined by the number of categories minus one.
- 😀 A p-value is used in chi-square tests to assess whether the results are statistically significant.
- 😀 If expected frequencies are too low (below 5), the chi-square test results may be inaccurate.
- 😀 Chi-square tests can also be used to determine if two categorical variables are independent or if they come from the same population.
Q & A
What is the main concept behind chi-square tests discussed in the video?
-Chi-square tests are used to assess how well observed data fits a specific distribution or model. In the video, they are applied to categorical data to determine whether differences between observed and expected frequencies are statistically significant.
How does a chi-square goodness of fit test work?
-In a chi-square goodness of fit test, we compare the observed frequency of categories to the expected frequencies based on a specific hypothesis. The test statistic is calculated by summing the squared differences between observed and expected counts, scaled by the expected counts.
What role do expected counts play in the chi-square test?
-Expected counts represent what we would anticipate observing if the null hypothesis were true. They are used in the denominator of the chi-square formula to scale the deviations, ensuring that larger samples or values have less weight than smaller ones.
What is the null hypothesis in the 'League of Lemurs' example?
-The null hypothesis in the 'League of Lemurs' example is that the distribution of character choices (Healers, Tanks, Assassins, and Fighters) matches the percentages provided by the game developers: 15%, 20%, 20%, and 45%, respectively.
How do degrees of freedom affect the chi-square distribution?
-Degrees of freedom (df) represent the number of independent pieces of information available to estimate variability. The shape of the chi-square distribution changes depending on the degrees of freedom, influencing the critical value and the resulting p-value used in hypothesis testing.
What is the significance of a p-value of 0.3 in the 'League of Lemurs' example?
-A p-value of 0.3 indicates that the observed data does not provide sufficient evidence to reject the null hypothesis. In this case, there’s no statistically significant difference between the expected and observed character distributions, meaning the game developers' percentages seem correct.
What is the chi-square test of independence, and how is it applied?
-The chi-square test of independence examines whether two categorical variables are related or independent. In the video, it is applied to determine if Hogwarts House preference is independent of whether a person likes pineapple on pizza, using a contingency table to analyze the relationship.
How does the chi-square test of homogeneity differ from the test of independence?
-The chi-square test of homogeneity is similar to the test of independence but is used to compare whether different samples come from the same population. Both tests use similar calculations, but the key difference lies in the types of hypotheses and the comparison of multiple groups or samples.
What are the assumptions that should be checked before performing a chi-square test?
-One key assumption is that the expected frequency for each category must be greater than 5. If the expected frequency is too low, the chi-square test may not be reliable. This assumption helps ensure the validity of the test results.
Why is the chi-square formula used to calculate the test statistic?
-The chi-square formula is used because it allows us to quantify the difference between observed and expected frequencies. Squaring the differences helps emphasize larger deviations, making it easier to detect statistically significant discrepancies.
Outlines

Cette section est réservée aux utilisateurs payants. Améliorez votre compte pour accéder à cette section.
Améliorer maintenantMindmap

Cette section est réservée aux utilisateurs payants. Améliorez votre compte pour accéder à cette section.
Améliorer maintenantKeywords

Cette section est réservée aux utilisateurs payants. Améliorez votre compte pour accéder à cette section.
Améliorer maintenantHighlights

Cette section est réservée aux utilisateurs payants. Améliorez votre compte pour accéder à cette section.
Améliorer maintenantTranscripts

Cette section est réservée aux utilisateurs payants. Améliorez votre compte pour accéder à cette section.
Améliorer maintenantVoir Plus de Vidéos Connexes


5.0 / 5 (0 votes)
