Penggunaan Metode Least Square Dalam Ramalan Penjualan
Summary
TLDRIn this video, the speaker explains the use of the least squares method for forecasting sales in a company. Using PT Sukses, which produces snack products, the video walks through the process of predicting future sales by analyzing historical data from 2016 to 2020. The speaker demonstrates how to calculate values for the least squares regression, including steps for computing sales projections for 2021. The process covers how to adjust for price increases, allocate sales across regions, and ensure that all calculations align with projected totals. The video concludes by confirming the accuracy of the forecast and encourages viewers to engage with further questions.
Takeaways
- 😀 The video introduces the use of the Least Squares method for sales forecasting in a corporate budgeting context.
- 😀 PT Sukses, a company selling snack products, uses sales data from 2016 to 2020 to forecast sales for 2021.
- 😀 The sales forecast involves regional sales distribution, with 60% allocated to West Java and 40% to Central Java.
- 😀 The sales pattern for 2021 is broken down by months and quarters, with specific percentages assigned to each period.
- 😀 A 20% increase in the selling price for 2021 is factored into the forecasted sales calculations.
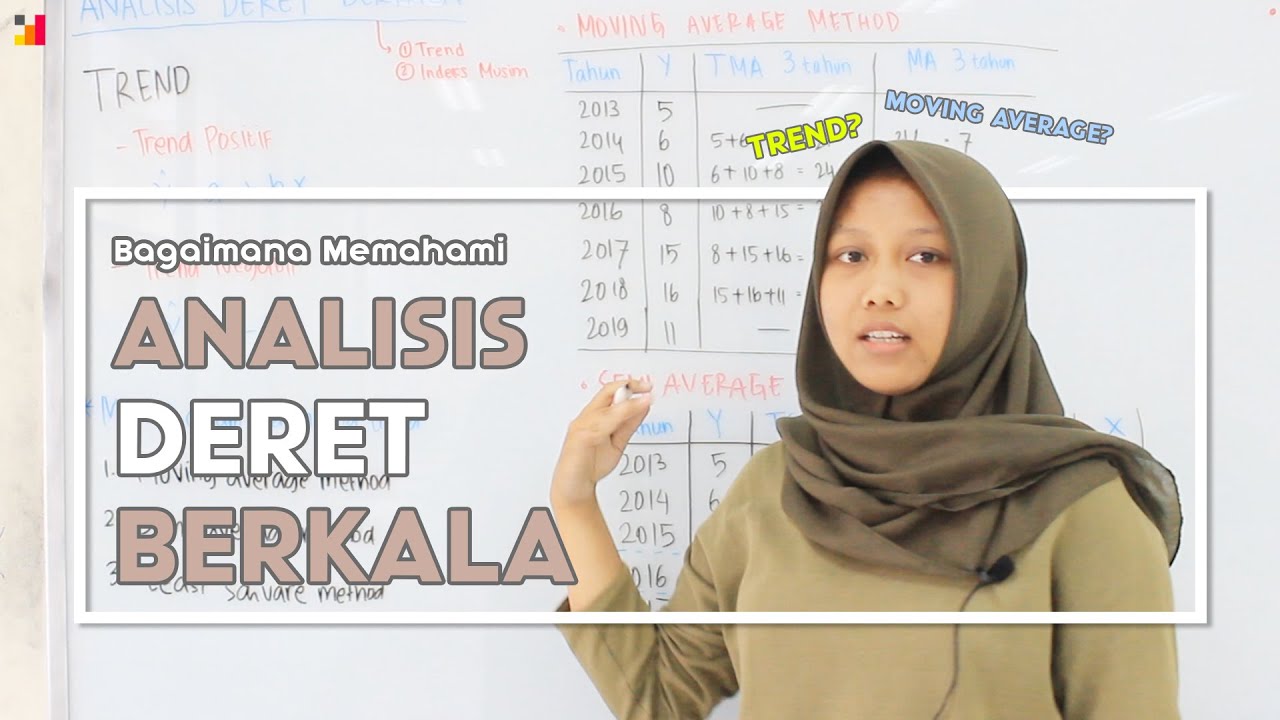
- 😀 The method starts with creating a table that includes years, sales data, predictions, and squared values for calculation.
- 😀 The 'X' values represent the years, with 2016 as the base year (X = 0) and the years thereafter assigned incrementing values.
- 😀 Using the Least Squares method, coefficients 'a' and 'b' are calculated to generate the linear equation for predicting future sales.
- 😀 The final sales prediction for 2021 is calculated using the obtained coefficients and adjusting for the price increase.
- 😀 The forecasted sales for 2021 are split between West Java and Central Java, with total sales values calculated for each region and the final check ensuring the totals align.
Q & A
What is the least squares method, and why is it used in sales forecasting?
-The least squares method is a statistical technique used to find the best-fitting line for a set of data points. It minimizes the sum of the squared differences between the observed values and the values predicted by the line. This method is used in sales forecasting to predict future sales based on historical data.
How is the sales data from 2016-2020 used in the forecasting process?
-The sales data from 2016-2020 is used as historical data to apply the least squares method. The data provides the basis for calculating the predicted sales for future years by determining the relationship between the years and sales figures.
What is the significance of choosing 2018 as the midpoint year for the calculations?
-Choosing 2018 as the midpoint year helps normalize the data by assigning it a value of zero. This makes it easier to calculate the regression coefficients, as years before 2018 are given negative values, and years after 2018 are given positive values.
How are the regression coefficients (a and b) calculated in the least squares method?
-The regression coefficients, 'a' (intercept) and 'b' (slope), are calculated using the formula for linear regression. The coefficient 'a' is the average sales value, while 'b' is determined by dividing the sum of the products of x and y by the sum of the squares of x.
What is the formula for the regression line used in this sales forecasting method?
-The formula for the regression line is: y = a + b * x, where 'y' is the predicted sales, 'a' is the intercept, 'b' is the slope, and 'x' is the value for the year being predicted.
Why is there a 20% price increase applied to the sales forecast for 2021?
-The 20% price increase is applied to the forecasted sales for 2021 to account for the company's plan to raise the price of their product. The increase is based on the assumption that the price will rise from the average price in 2020.
How is the sales projection split between the two regions, Jawa Barat and Jawa Tengah?
-The total projected sales for 2021 are split with 60% allocated to Jawa Barat and 40% to Jawa Tengah. This regional distribution is based on the company's sales strategy for these regions.
What are the sales distribution percentages for each month in 2021?
-The sales distribution for 2021 is as follows: 5% in January, 10% in February, 15% in March, 20% in Q2 (April-June), and 25% each in Q3 (July-September) and Q4 (October-December).
How do you verify if the sales forecast calculations are correct?
-To verify the calculations, the total sales for both regions (Jawa Barat and Jawa Tengah) are added together. If the sum matches the total projected sales, the forecast is considered accurate.
What is the purpose of multiplying sales by the projected price to find the total sales for 2021?
-Multiplying the projected sales by the adjusted price for 2021 gives the total revenue or sales value for the company. This is essential for determining the financial impact of the sales forecast.
Outlines

Cette section est réservée aux utilisateurs payants. Améliorez votre compte pour accéder à cette section.
Améliorer maintenantMindmap

Cette section est réservée aux utilisateurs payants. Améliorez votre compte pour accéder à cette section.
Améliorer maintenantKeywords

Cette section est réservée aux utilisateurs payants. Améliorez votre compte pour accéder à cette section.
Améliorer maintenantHighlights

Cette section est réservée aux utilisateurs payants. Améliorez votre compte pour accéder à cette section.
Améliorer maintenantTranscripts

Cette section est réservée aux utilisateurs payants. Améliorez votre compte pour accéder à cette section.
Améliorer maintenantVoir Plus de Vidéos Connexes

How to make Forecasting! | Quantitative Forecasting with Least Squares Method | Quickly & easily

Fitting of an Exponential Curve of the Type 𝒚=𝒂𝒆(^𝒃𝒙)
Analisis Deret Berkala - Pengantar Statistika Ekonomi dan Bisnis (Statistik 1) | E-Learning STA

Analisis Regresi Sederhana - Statistika Ekonomi dan Bisnis Lanjutan (Statistik 2) | E-Learning STA

Akuntansi Biaya Bab 3: Analisis Perilaku Biaya
Metode Kuadrat Terkecil Hal 97-101 Bab 3 STATISTIK Kelas 11 SMA Kurikulum Merdeka
5.0 / 5 (0 votes)
