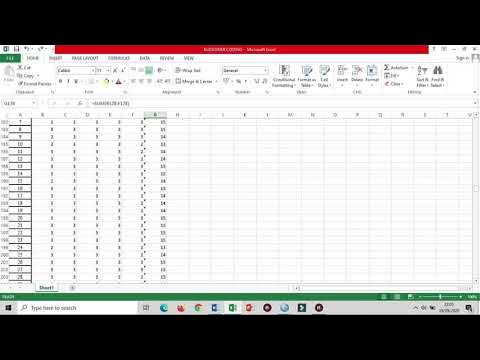
CARA ANALISA DESKRIPTIF TINGKAT CAPAIAN RESPONDEN,TCR,TOTAL SKOR,RATA RATA,MEAN,KATEGORI,EXCEL SPSS
Summary
TLDRThis video tutorial guides viewers through the process of analyzing questionnaire data for thesis or research projects. It explains how to transfer questionnaire data from Word to Excel, organize it for analysis, and use SPSS for descriptive statistics like mean, median, and standard deviation. The tutorial covers important aspects such as coding negative questionnaires, interpreting results, calculating average scores, and categorizing responses. The content is aimed at helping students or researchers efficiently process their survey data, and includes practical tips for creating clean and accurate tables and reports for thesis defense.
Takeaways
- 😀 The video introduces the process of analyzing questionnaire data, specifically focusing on descriptive analysis for research.
- 😀 The importance of transferring data from a Word document to Excel is highlighted as a necessary step for organizing the data.
- 😀 The script emphasizes how to properly format Excel columns and adjust them to make the data more readable.
- 😀 The video explains the process of creating a data tabulation, including PCR (Percentage Cumulative Respondent) and mean scores for each question.
- 😀 It is important to use a negative questionnaire format (where the highest score corresponds to 'Strongly Disagree') in certain research contexts.
- 😀 A key part of the analysis involves coding the data correctly in SPSS and ensuring all values are properly entered and transposed for accurate results.
- 😀 The video demonstrates how to use formulas to calculate the total score and mean score for each question, emphasizing the need to handle Likert scale data properly.
- 😀 The process also covers how to generate descriptive statistics, such as mean, median, mode, standard deviation, and variance, from the data.
- 😀 After performing the analysis in SPSS, the video guides the user in copying and pasting the results back into Excel for further processing and presentation.
- 😀 The video also touches on the process of interpreting results and applying categories like 'Very Good', 'Good', 'Sufficient', and 'Poor' based on the computed scores.
Q & A
Why is it important to move questionnaire data from Word to Excel?
-Moving data from Word to Excel makes it easier to organize, format, and manipulate the data for analysis. Excel provides a structured format that allows for better sorting, filtering, and calculation of responses.
What is PCR in the context of this research, and why is it significant?
-PCR stands for Percentage Cumulative Respondent, which measures the level of agreement or achievement of respondents based on their answers. It is significant because it helps assess the overall response quality and categorize the results (e.g., very good, good, etc.).
What does the speaker mean by 'negative questionnaire' and why is it important?
-A 'negative questionnaire' refers to a set of questions where the highest score (usually for agreement) is assigned to the lowest level of agreement (e.g., 'strongly disagree'). This is important for reversing the scale in analysis, ensuring that responses are consistently evaluated for comparison.
How does the speaker recommend organizing the data for SPSS?
-The speaker advises cleaning up the data in Excel first by removing spaces and ensuring it is formatted correctly. After this, the data can be copied and pasted into SPSS, where each variable (e.g., X1, X2) is clearly defined and ready for analysis.
What are the key descriptive statistics to analyze in SPSS according to the video?
-The key descriptive statistics include the mean, median, mode, sum, standard deviation, variance, and minimum and maximum values. These statistics help to summarize the central tendency and variability of the data.
What is the role of formulas in calculating scores in this research process?
-Formulas are used to calculate the total score based on respondent answers. These formulas ensure that scores are correctly computed, particularly when dealing with negative questions, where the scale needs to be reversed.
How does the speaker handle negative questions in scoring?
-For negative questions, the highest value (e.g., 'strongly disagree') is assigned the highest numerical score, and the scores are reversed accordingly. This ensures that all responses are consistent with the scale, even if the questions are phrased negatively.
What is the importance of using the Likert scale in this analysis?
-The Likert scale is essential for categorizing responses based on levels of agreement or disagreement. It allows for standardized measurement across different questions, which simplifies the analysis and comparison of responses.
How does the speaker recommend dealing with data output from SPSS?
-The speaker recommends copying the output data from SPSS into Excel for further processing. This allows for easier manipulation and formatting of the results, such as calculating totals, averages, and categorizing responses.
What steps should be taken if there is an error in the calculated scores?
-If there is an error in the calculated scores, the speaker advises checking the formulas to ensure they are correctly applied, especially for negative questions. The results should match the output from SPSS, and discrepancies likely indicate issues with the formulas.
Outlines

Cette section est réservée aux utilisateurs payants. Améliorez votre compte pour accéder à cette section.
Améliorer maintenantMindmap

Cette section est réservée aux utilisateurs payants. Améliorez votre compte pour accéder à cette section.
Améliorer maintenantKeywords

Cette section est réservée aux utilisateurs payants. Améliorez votre compte pour accéder à cette section.
Améliorer maintenantHighlights

Cette section est réservée aux utilisateurs payants. Améliorez votre compte pour accéder à cette section.
Améliorer maintenantTranscripts

Cette section est réservée aux utilisateurs payants. Améliorez votre compte pour accéder à cette section.
Améliorer maintenantVoir Plus de Vidéos Connexes

CARA MEMASUKKAN DATA KUESIONER KE SPSS - Beserta Uji Statistik Deskriptif

2. Praktik NVivo dari Nol_Tampilan dan Fitur NVivo

Cara Membuat Skripsi dengan AI Auto Lulus Cepet | Braintext AI

cara mencari mean, median dan mode dari awal kuesioner, tabulasi dan menggunakan spss sampai hasil

Cara Mudah Mencari Distribusi Frekuensi Dengan SPSS

How Would You Invest $100 Million in Real Estate? [Interview Prep]
5.0 / 5 (0 votes)
