GRINGS - Amostragem com Distribuição Normal aula 15
Summary
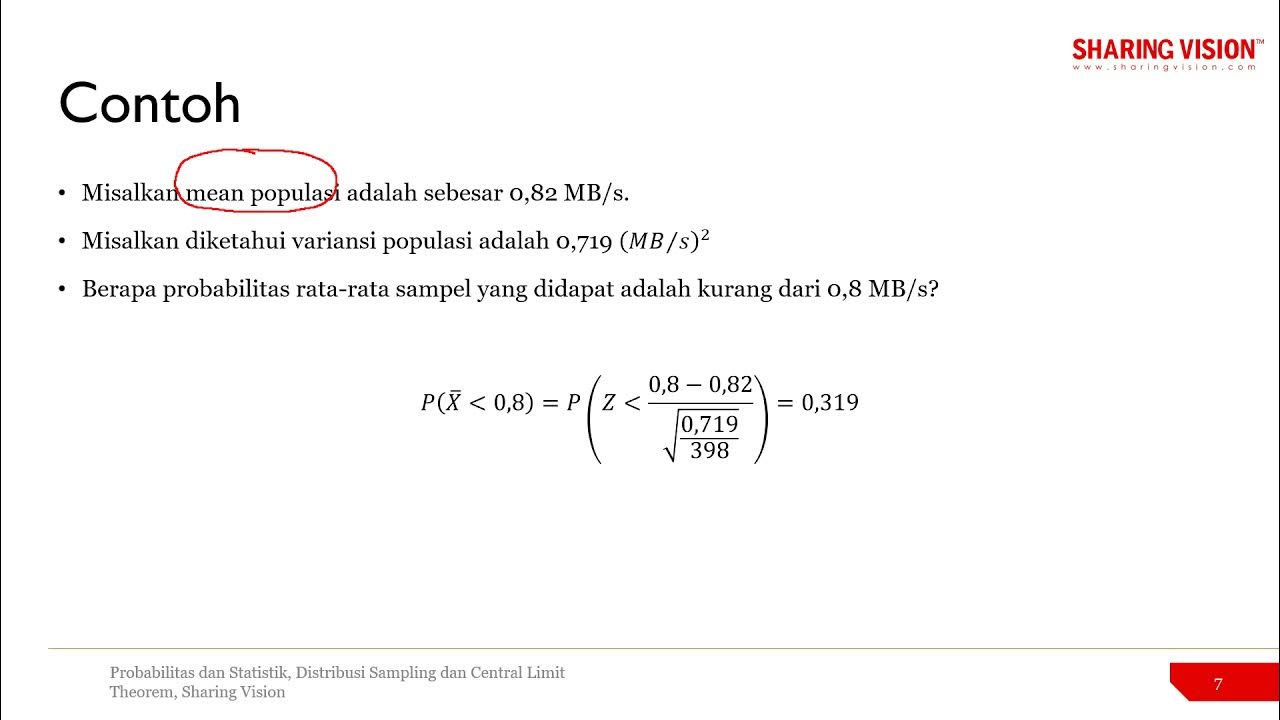
TLDRThe script explains how to calculate probabilities using the normal distribution, focusing on the income of employees in a company. It covers two main tasks: first, calculating the probability of selecting an employee with an income above a certain threshold (1750), and second, determining the probability of sample means exceeding that same threshold in samples of sizes 9 and 25. The explanation emphasizes the difference in variability between individual selections and sample means, demonstrating the effects of sample size on the probability of deviation from the population mean. Detailed calculations and the use of z-scores are provided throughout.
Takeaways
- 😀 The normal distribution is used to calculate the probability of an employee earning above a specific income.
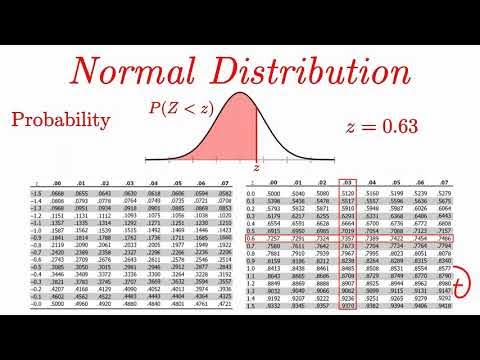
- 😀 Z-scores are used to convert the raw data into standardized scores, helping in probability calculations.
- 😀 For individual income probabilities, Z-scores are calculated as (X - μ) / σ.
- 😀 To calculate probabilities for sample means, the standard error (SE) formula is used: SE = σ / √n.
- 😀 As the sample size increases, the probability of sample means deviating from the population mean decreases due to a smaller standard error.
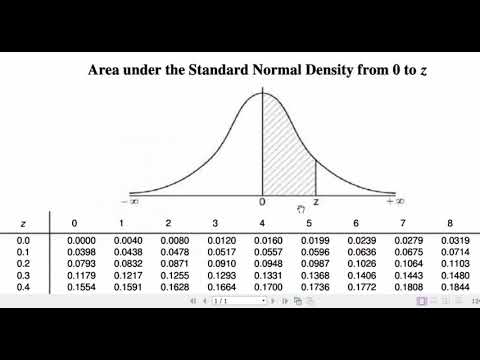
- 😀 The Z-table provides areas to the left of a given Z-score, and symmetrical areas are used for areas to the right.
- 😀 A Z-score of -16.5 indicates an extremely low probability for an individual earning more than 1750, as it's far from the population mean.
- 😀 For sample sizes of 9 and 25, the probability of having sample means above 1750 is also extremely low due to large negative Z-scores.
- 😀 The larger the sample size, the more concentrated the sample means are around the population mean, making it harder for the sample mean to deviate significantly.
- 😀 In the second scenario with a different population (mean = 600, standard deviation = 150), Z-scores are calculated for income ranges like 450 and 550, leading to a small probability for the range.
- 😀 When the sample size increases, like in the second scenario with a sample size of 36, the standard error decreases, making the sample mean less likely to deviate from the population mean.
Q & A
What is the purpose of calculating the Z-score in this script?
-The Z-score is calculated to standardize the data, transforming it into a standard normal distribution. This allows us to find the probability of an event occurring in relation to the given normal distribution.
What does the script indicate about the probability of selecting a person with an income greater than 1,750?
-The script shows that the probability of selecting an individual with an income greater than 1,750 is almost zero, as the Z-score is extremely negative (-16.5). This means the value is far below the mean and essentially impossible.
How does the script explain the difference between individual selection and sample mean calculation?
-The script explains that while selecting an individual from the population can result in large deviations from the mean, the mean of a sample is more likely to be close to the population mean. This is because larger samples reduce variability, making the sample mean more reliable and concentrated around the population mean.
What formula is used to calculate the Z-score for a sample mean?
-The formula used for the Z-score of a sample mean is: Z = (X - μ) / (σ / √n), where X is the sample mean, μ is the population mean, σ is the population standard deviation, and n is the sample size.
Why does the script show that the probability for a sample of size 25 is still almost zero?
-Even with a sample size of 25, the Z-score remains extremely negative (-82.5), indicating that the sample mean of 1,750 is still far from the population mean of 10,000. As a result, the probability of observing such a sample mean is practically zero.
What is the role of the standard normal distribution table in the calculations?
-The standard normal distribution table is used to find the cumulative probability associated with a specific Z-score. Since the table provides the area to the left of a Z-score, we can use symmetry to determine probabilities for areas to the right or other parts of the distribution.
What is the significance of using a larger sample size in this context?
-Larger sample sizes make the sample mean more concentrated around the population mean. This reduces the probability of obtaining extreme values far from the mean, making the distribution of the sample mean narrower and more reliable.
How does the script explain the probability of a sample mean being greater than 1,750 for a sample size of 9?
-For a sample size of 9, the Z-score is -49.5, which is extremely negative, indicating that the probability of obtaining a sample mean greater than 1,750 is almost zero. This is because the sample mean is more likely to be closer to the population mean, reducing variability.
What is the interpretation of the Z-score values of -2 and -6 in the final part of the script?
-The Z-scores of -2 and -6 correspond to the probability of the sample mean being between 450 and 550. The Z-score of -2 yields a probability of 0.0228, while the Z-score of -6 is essentially zero, meaning the probability of the sample mean being in this range is very small.
What is the result of the probability calculation for the sample mean between 450 and 550 for a sample size of 36?
-The probability of the sample mean being between 450 and 550 for a sample size of 36 is 2.28%. This is calculated by finding the area under the normal curve between Z-scores of -2 and -6, where the area under Z = -2 is 0.0228 and the area under Z = -6 is effectively zero.
Outlines

Cette section est réservée aux utilisateurs payants. Améliorez votre compte pour accéder à cette section.
Améliorer maintenantMindmap

Cette section est réservée aux utilisateurs payants. Améliorez votre compte pour accéder à cette section.
Améliorer maintenantKeywords

Cette section est réservée aux utilisateurs payants. Améliorez votre compte pour accéder à cette section.
Améliorer maintenantHighlights

Cette section est réservée aux utilisateurs payants. Améliorez votre compte pour accéder à cette section.
Améliorer maintenantTranscripts

Cette section est réservée aux utilisateurs payants. Améliorez votre compte pour accéder à cette section.
Améliorer maintenantVoir Plus de Vidéos Connexes

The Normal Distribution and Shoplifting (DeSTRESS Film 12)
Probabilitas dan Statistik: 8.8 Central Limit Theorem Contoh
Peluang Distribusi NORMAL beserta Contoh Soal Pembahasan

Finding Areas Using the Standard Normal Table (for tables that give the area between 0 and z)

Math 220 Sec 8 5 Part 1
Normal Distribution EXPLAINED with Examples
5.0 / 5 (0 votes)
