The Normal Distribution and Shoplifting (DeSTRESS Film 12)
Summary
TLDRThis video script explores the concept of normal distribution in statistics, illustrating its applications in various fields such as shoplifting, income distribution, and intelligence measurements. Through a detailed example of shoplifting at a store, it demonstrates how normal distribution helps calculate probabilities, such as the likelihood of daily losses and the amount a store can expect to lose. By transforming data into a standard normal distribution, the video highlights the power of statistical analysis in understanding patterns and making informed decisions in business and beyond.
Takeaways
- 😀 Normal distribution is a vital concept in statistics and can be applied to various real-world phenomena, like people's weight or tree diameters.
- 😀 A normal distribution typically has a few extreme values at both ends (e.g., small and large trees) and many values near the mean.
- 😀 The principles of normal distribution can be used to analyze things like stock market returns, wealth distribution, and intelligence quotients.
- 😀 Shoplifting is a significant concern for retailers, and while prevention is costly, it's a factor businesses must account for in their operations.
- 😀 Theft in retail environments can be difficult to control, but businesses use various methods, like security systems and surveillance, to manage losses.
- 😀 Despite efforts to prevent theft, many businesses accept some level of loss and factor it into their pricing or profit margins.
- 😀 Shoplifting increases the cost of retail, estimated at around 1/3 of 1% of sales, which can add an average of £130 to a family's annual shopping bill.
- 😀 The pattern of losses due to theft typically follows a normal distribution, allowing businesses to predict and manage potential losses more effectively.
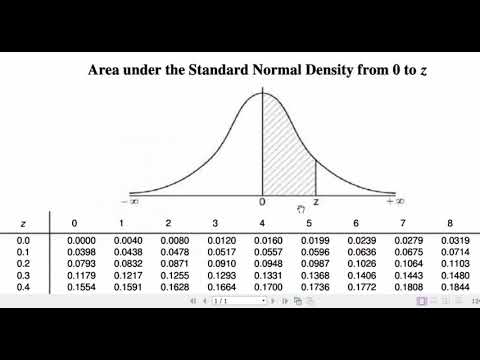
- 😀 The standard normal distribution has a mean of zero and a standard deviation of one, and normal distributions can be transformed using the Z-score formula.
- 😀 Z-scores are used to calculate probabilities and can help businesses assess the likelihood of particular levels of theft or loss.
- 😀 By converting normal distributions to standard normal distributions, businesses can solve practical problems, such as predicting loss ranges or assessing risk.
Q & A
What is the significance of normal distribution in statistics?
-Normal distribution is one of the most important concepts in statistics. It is used to represent a wide variety of phenomena, such as the distribution of people's weight, tree diameters, IQ scores, income distribution, and even stock returns. It helps in understanding and predicting probabilities of different outcomes in these phenomena.
How can the normal distribution be applied to real-world problems?
-Normal distribution can be applied to many real-world problems, such as predicting the probability of a store losing more than a certain amount due to theft, analyzing wealth and income distribution, and even forecasting stock market returns. In the example from the script, it is applied to understand the theft patterns in retail stores.
What is the standard normal distribution?
-The standard normal distribution is a special case of the normal distribution with a mean of zero and a standard deviation of one. It is used to standardize normal distributions and is useful for comparing different datasets or solving statistical problems.
What is a Z-score, and how is it calculated?
-A Z-score is a standardized value that tells you how many standard deviations a data point is from the mean of a distribution. It is calculated using the formula Z = (X - μ) / σ, where X is the value, μ is the mean, and σ is the standard deviation of the original distribution.
How does shoplifting impact retail businesses, according to the script?
-Shoplifting adds to the cost of running a retail business, with the estimated loss being about 0.33% of sales, which contributes around £130 to the average family's annual shopping bill. While businesses try to control theft through security systems and surveillance, they often accept some level of theft as a cost of doing business.
What role do security devices play in preventing shoplifting?
-Security devices like electronic item tags and gates help prevent shoplifting, but they come at a cost. These systems reduce theft, but the expense associated with installing and maintaining them may reduce the business's profits.
How is the probability of shoplifting losses calculated in the example?
-The probability of shoplifting losses is calculated using the standard normal distribution and Z-scores. For example, to calculate the chance of losing more than £250 on a given day, the Z-score is calculated using the formula Z = (X - μ) / σ, and then the corresponding probability is found using a Z-table.
What does the probability of a loss between £250 and £350 represent?
-The probability of a loss between £250 and £350 is determined by subtracting the probability of losses exceeding £350 from the probability of losses less than £250. In the example, this value is 0.475, meaning there's a 47.5% chance of the loss being between £250 and £350 on a given day.
How is the minimum loss the store can expect to incur on 95% of days determined?
-To find the minimum amount the store can expect to lose on 95% of days, the script uses a Z-score of -1.65 (representing the lowest 5% in the left tail of the normal distribution). The formula Z = (X - μ) / σ is used to calculate the loss, resulting in a value of £150.50, meaning the store can expect to lose at least this amount on 95% of the days.
What types of data can be modeled using the normal distribution, as mentioned in the script?
-The normal distribution can model various types of data, including physical measurements like tree diameters, human characteristics such as intelligence quotients (IQ), and social phenomena like income distribution. It can also be applied to business metrics like theft losses or stock market returns.
Outlines

This section is available to paid users only. Please upgrade to access this part.
Upgrade NowMindmap

This section is available to paid users only. Please upgrade to access this part.
Upgrade NowKeywords

This section is available to paid users only. Please upgrade to access this part.
Upgrade NowHighlights

This section is available to paid users only. Please upgrade to access this part.
Upgrade NowTranscripts

This section is available to paid users only. Please upgrade to access this part.
Upgrade NowBrowse More Related Video
Peluang Distribusi NORMAL beserta Contoh Soal Pembahasan

Distribusi Pareto

Tutorial 11- Log Normal Distribution Explained In Hindi
The Normal Distribution: Crash Course Statistics #19

Probabilitas dan Statistik: 8.6 Central Limit Theorem
Binomial distribution # Explanation with notes# Properties of binomial distribution.
5.0 / 5 (0 votes)