Statistik Inferensial
Summary
TLDRThis video tutorial covers the fundamentals of inferential statistics, highlighting key concepts such as the differences between descriptive and inferential statistics. It explains the importance of understanding data measurement levels (nominal, ordinal, interval, ratio) to choose the appropriate statistical tests. The video also contrasts parametric and non-parametric tests, discussing when each should be used based on data types and assumptions like normality. Practical examples are provided, such as using independent t-tests for comparing two groups and ANOVA for comparing more than two. The content offers a comprehensive guide for selecting the right analysis techniques based on research goals.
Takeaways
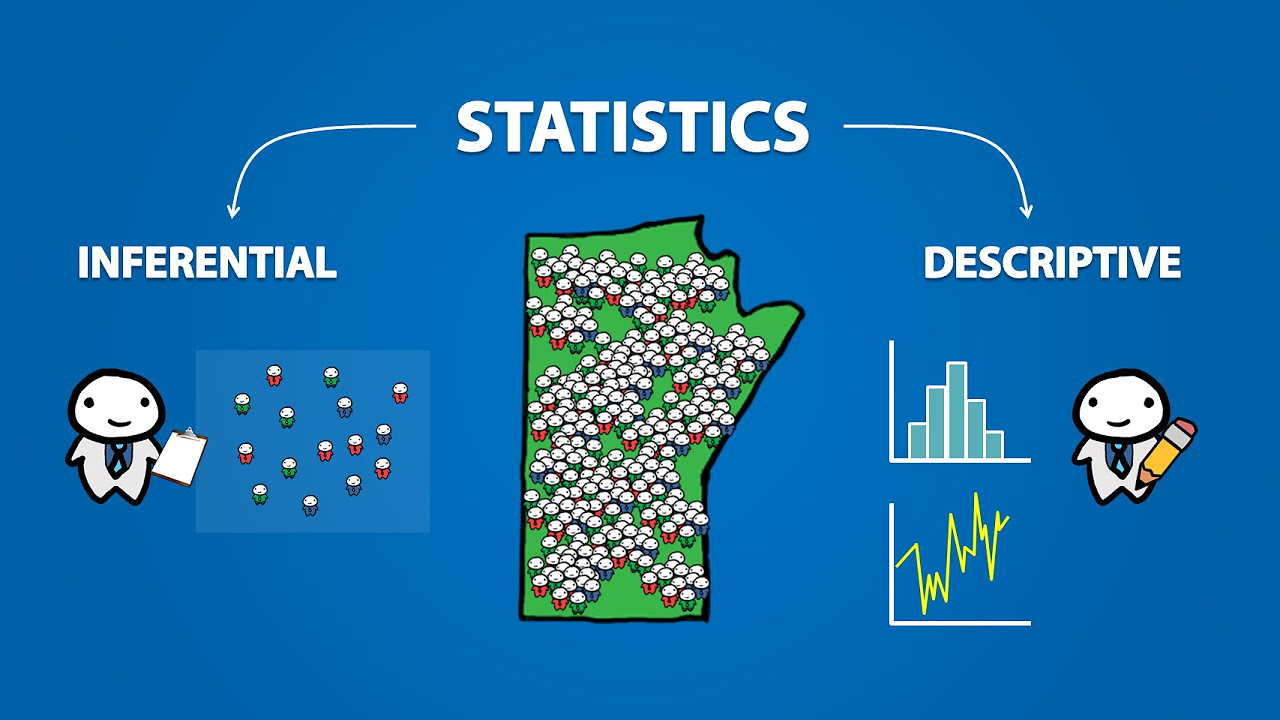
- 😀 Descriptive statistics summarize data characteristics like mean, median, and mode.
- 😀 Inferential statistics are used to make predictions or inferences about a population based on sample data.
- 😀 It's crucial to understand the level of measurement of your data: nominal, ordinal, interval, or ratio.
- 😀 Parametric tests are used for interval or ratio data and assume normality and other criteria.
- 😀 Non-parametric tests are applied to ordinal or nominal data and do not require assumptions of normality.
- 😀 Pearson correlation is used to examine the relationship between two interval or ratio variables.
- 😀 Spearman correlation is used when analyzing the relationship between ordinal data.
- 😀 Independent sample t-tests compare two independent groups, such as male vs. female.
- 😀 Paired sample t-tests compare two related groups, such as measurements taken before and after treatment.
- 😀 One-way ANOVA is used to compare more than two independent groups, such as different ethnic groups.
- 😀 Always verify assumptions like normality and linearity before using parametric tests to ensure validity.
Q & A
What is the main focus of the video?
-The main focus of the video is to introduce inferential statistics, explaining the differences between descriptive and inferential statistics and discussing various statistical tests used for analyzing data.
Why is it important to understand the level of measurement in data?
-Understanding the level of measurement (nominal, ordinal, interval, ratio) is important because it helps determine which statistical analysis methods are appropriate for analyzing the data correctly.
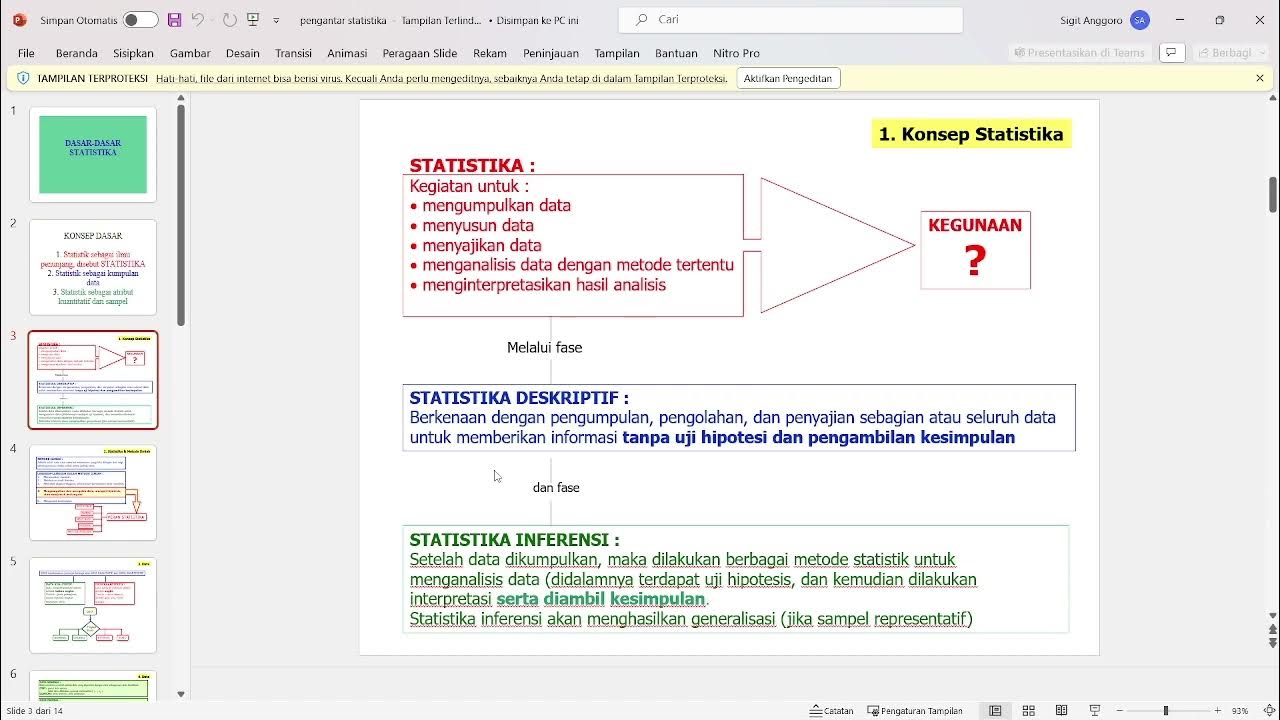
What is the difference between descriptive and inferential statistics?
-Descriptive statistics summarize and describe the characteristics of a dataset, while inferential statistics allow us to make predictions or generalizations about a population based on sample data.
What are the four main levels of measurement discussed in the video?
-The four main levels of measurement are nominal, ordinal, interval, and ratio. Nominal refers to categorical data, ordinal refers to ordered data, interval refers to data with equal intervals but no true zero, and ratio has both equal intervals and a true zero.
What is the significance of choosing the right statistical test?
-Choosing the right statistical test is crucial for obtaining valid and meaningful results. The correct test depends on the level of measurement of the data, the type of analysis (e.g., relationship or difference), and the assumptions that need to be met.
What are parametric tests, and when are they used?
-Parametric tests are statistical tests that assume the data follows a specific distribution (e.g., normal distribution). They are used for interval or ratio data when the assumptions of normality and linearity are met.
What are non-parametric tests, and when should they be used?
-Non-parametric tests are used when the data does not meet the assumptions required for parametric tests, such as normality or equal variance. They are commonly used for ordinal data or when the data does not meet parametric assumptions.
Can you explain the difference between an independent sample t-test and a paired sample t-test?
-An independent sample t-test is used to compare the means of two independent groups, while a paired sample t-test is used when the same group is measured at two different points in time or under different conditions.
What is one-way ANOVA, and when is it used?
-One-way ANOVA is used to compare the means of more than two independent groups. It is applicable when there are multiple groups, and you want to test whether there is a significant difference among them.
What are some key assumptions of parametric tests?
-Key assumptions of parametric tests include normality (data should be normally distributed), linearity (relationships between variables should be linear), and homogeneity of variance (group variances should be equal).
Outlines

Cette section est réservée aux utilisateurs payants. Améliorez votre compte pour accéder à cette section.
Améliorer maintenantMindmap

Cette section est réservée aux utilisateurs payants. Améliorez votre compte pour accéder à cette section.
Améliorer maintenantKeywords

Cette section est réservée aux utilisateurs payants. Améliorez votre compte pour accéder à cette section.
Améliorer maintenantHighlights

Cette section est réservée aux utilisateurs payants. Améliorez votre compte pour accéder à cette section.
Améliorer maintenantTranscripts

Cette section est réservée aux utilisateurs payants. Améliorez votre compte pour accéder à cette section.
Améliorer maintenant


5.0 / 5 (0 votes)
