Distribusi Normal Bagian 1 Matematika Minat Kelas XII Semester 2
Summary
TLDRIn this video, the speaker introduces the concept of normal distribution, explaining its properties and how it is represented by the bell curve. Key features of the normal distribution are covered, such as symmetry, the relationship between the mean, median, and mode, and the area under the curve. The video also delves into calculations related to probabilities using Z-scores and distribution tables, with practical examples of how to find the probability for specific Z-values. The speaker emphasizes the importance of understanding these concepts for students and provides a thorough walkthrough of each example.
Takeaways
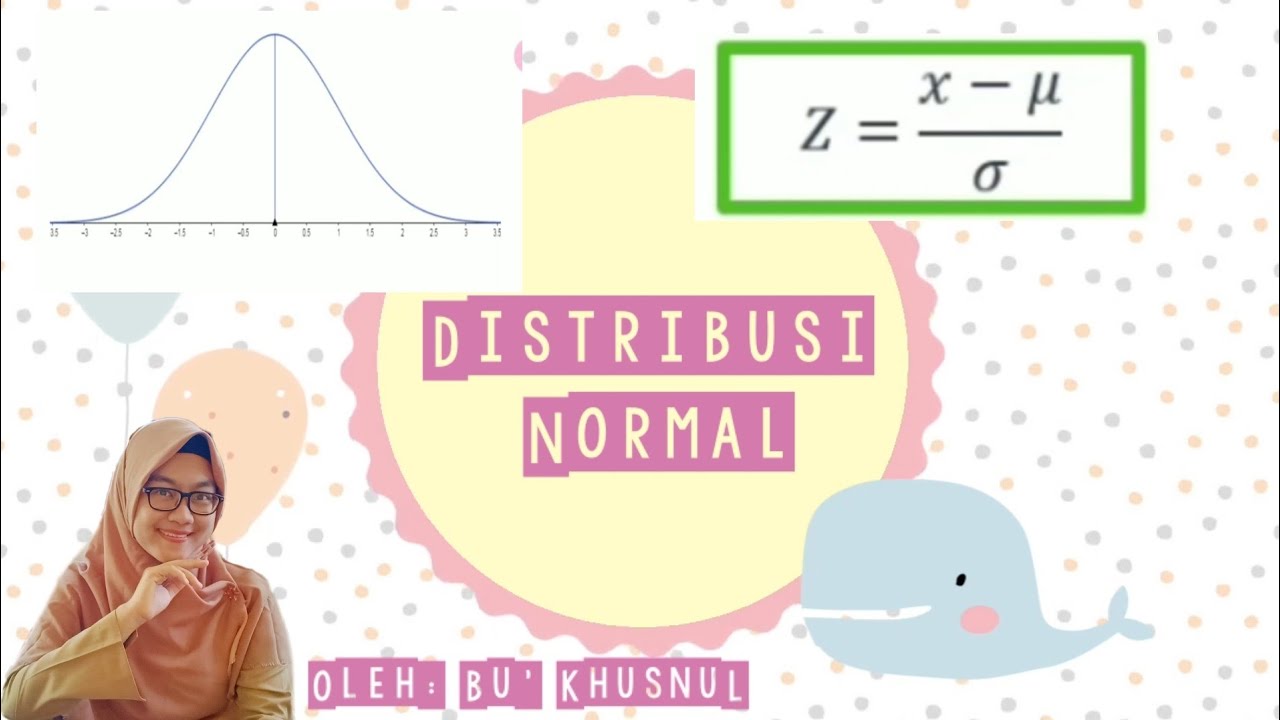
- 😀 The topic of the video is the first part of normal distribution, which is a continuous random variable distribution using the normal curve.
- 😀 Normal distribution is defined as the distribution of a random variable X with a mean (Miu) and standard deviation (Sigma), represented as X ~ N(Miu, Sigma).
- 😀 The normal curve, also known as the bell curve or Gaussian curve, has several key properties: it is always above the x-axis, symmetric, and the mean, median, and mode are all equal.
- 😀 The curve has asymptotes along the x-axis and the total area under the curve is equal to 1, meaning the total probability is 1.
- 😀 The general form of the probability function for a normally distributed variable X is given by the equation with specific parameters for the mean and standard deviation.
- 😀 To simplify normal distribution, it is often standardized into the standard normal distribution, where the mean is 0 and the standard deviation is 1.
- 😀 The Z-score transformation is used to convert values into the standard normal distribution, and this allows for easy calculation of probabilities using Z-tables.
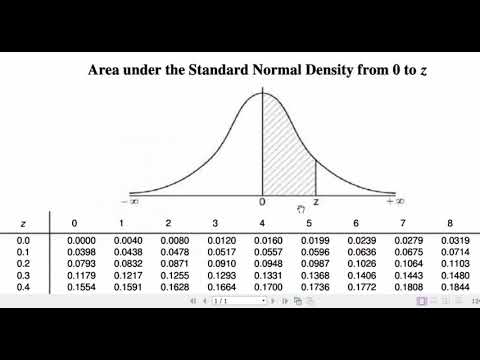
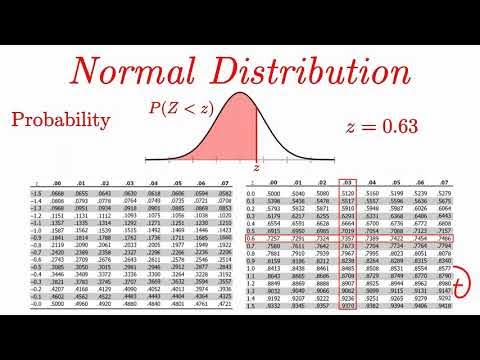
- 😀 The Z-table is used to find the probability corresponding to specific Z-scores, which represent the standard deviations from the mean.
- 😀 The video provides examples of how to calculate probabilities for Z-scores, such as determining the probability that Z is less than 1.35 or greater than 0.
- 😀 The video also covers how to calculate probabilities for intervals of Z-scores and how to use Z-tables for more complex probability calculations.
Q & A
What is the normal distribution?
-The normal distribution is a continuous probability distribution for a random variable, often depicted as a bell-shaped curve. It is characterized by its mean (μ) and standard deviation (σ), and it follows a specific mathematical formula.
What are the key properties of the normal distribution curve?
-The key properties of the normal distribution curve include: (1) it is always above the x-axis, (2) it is symmetric, (3) the mean, median, and mode are equal, (4) it has horizontal asymptotes at the x-axis, and (5) the total area under the curve equals 1.
What is the standard normal distribution?
-The standard normal distribution is a special case of the normal distribution where the mean (μ) is 0 and the standard deviation (σ) is 1. It is often used to standardize values, converting them into Z-scores.
How do we convert a normal distribution to a standard normal distribution?
-To convert a normal distribution to a standard normal distribution, you use the formula Z = (X - μ) / σ, where X is the value from the original distribution, μ is the mean, and σ is the standard deviation.
What is the Z-table, and how is it used?
-The Z-table provides the cumulative probability for standard normal distribution (Z-scores). It helps to determine the area under the curve for a given Z-value, allowing you to find probabilities associated with different Z-scores.
What does the probability P(Z < a) represent?
-P(Z < a) represents the probability that a Z-value (a standardized value from a normal distribution) is less than a specific value 'a'. It corresponds to the area under the standard normal curve to the left of 'a'.
What does P(Z > a) represent, and how is it calculated?
-P(Z > a) represents the probability that a Z-value is greater than a specific value 'a'. It is calculated by subtracting P(Z < a) from 1, since the total area under the curve is 1.
How do you calculate the probability for a range of Z-values, say P(Z1 < Z < Z2)?
-To calculate the probability for a range of Z-values, you find the cumulative probabilities for both Z1 and Z2 using the Z-table, then subtract the probability for Z1 from the probability for Z2.
How do you find a Z-value given a probability, such as P(Z < a) = 0.3?
-To find a Z-value given a probability, you look up the probability in the Z-table to find the corresponding Z-score. In this case, you find the closest cumulative probability to 0.3 in the Z-table, which gives the Z-value.
How do you calculate the probability for two Z-values, such as P(Z < 1.32 and Z > -2.30)?
-To calculate the probability for two Z-values, you split it into two parts. First, calculate P(Z < 1.32) and P(Z > -2.30). Then, combine these values according to the situation—by adding or subtracting depending on the range of interest.
Outlines

Cette section est réservée aux utilisateurs payants. Améliorez votre compte pour accéder à cette section.
Améliorer maintenantMindmap

Cette section est réservée aux utilisateurs payants. Améliorez votre compte pour accéder à cette section.
Améliorer maintenantKeywords

Cette section est réservée aux utilisateurs payants. Améliorez votre compte pour accéder à cette section.
Améliorer maintenantHighlights

Cette section est réservée aux utilisateurs payants. Améliorez votre compte pour accéder à cette section.
Améliorer maintenantTranscripts

Cette section est réservée aux utilisateurs payants. Améliorez votre compte pour accéder à cette section.
Améliorer maintenantVoir Plus de Vidéos Connexes

Metode Statistika | Sebaran Peluang Kontinu | Mengenal Sebaran Normal
Distribusi Normal | Konsep Dasar dan Sifat Kurva Normal | Matematika Peminatan Kelas 12

Apa itu Kurva Normal?
Peluang Distribusi NORMAL beserta Contoh Soal Pembahasan
Normal Distribution EXPLAINED with Examples

Z-Scores, Standardization, and the Standard Normal Distribution (5.3)
5.0 / 5 (0 votes)
