Analisis Statistik Deskriptif dengan SPSS beserta Interpretasinya

Mitha Kartika
20 Aug 202208:55

Summary

TLDRThis video script provides a step-by-step tutorial on preparing respondent data and conducting descriptive statistical analysis using SPSS. The presenter guides viewers on how to input variables, label them appropriately, and enter data into the software. They then demonstrate how to check data completeness, perform the analysis, and interpret the results, focusing on variables like price (X1), product quality (X2), and consumer loyalty (Y). The tutorial aims to give a general overview of the data, including mean values, maximum and minimum values, and standard deviation for each variable. The presenter also encourages viewers to like, subscribe, and share the video if they find it helpful.

Takeaways

  • 😀 The video is a tutorial on preparing respondent data for statistical analysis in SPSS.
  • 📊 The example given involves three variables: two independent variables (X1 and X2) and one dependent variable (Y).
  • 💻 Viewers are instructed to open SPSS and enter variable names such as 'X1', 'X2', and 'Y' in the Variable View.
  • 🏷️ Labels for the variables are suggested to be descriptive, like 'harga' (price) for X1, 'kualitas produk' (product quality) for X2, and 'loyalitas konsumen' (consumer loyalty) for Y.
  • 📋 The script demonstrates how to copy and paste data from a data view into SPSS for analysis.
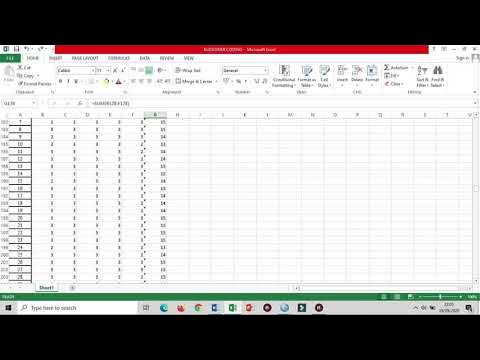
  • 🔍 The presenter checks for completeness of the data, mentioning that there should be 30 respondents in the example.
  • 📊 The video covers how to perform a descriptive statistical analysis in SPSS, including selecting options like mean, standard deviation, maximum, and minimum.
  • 📈 The results of the descriptive statistics are interpreted to provide a general overview of the data, such as average values and variability.
  • 📝 The presenter copies the results from the output and uses them for interpretation, providing specific values for minimum, maximum, mean, and standard deviation.
  • 👨‍🏫 The tutorial is aimed at helping viewers understand how to conduct and interpret a descriptive statistical analysis in SPSS.
  • 👍 The video concludes with a reminder to like, subscribe, and share the content, indicating the end of the tutorial.

Q & A

  • What is the main purpose of the video?

    -The main purpose of the video is to demonstrate how to input and analyze respondent data using SPSS, specifically focusing on descriptive statistics.

  • How many variables are used in the example provided in the video?

    -Three variables are used in the example: two independent variables (X1 and X2) and one dependent variable (Y).

  • What are the labels given to the variables in the video example?

    -The labels given are 'harga' for X1, 'kualitas produk' for X2, and 'loyalitas konsumen' for Y.

  • What is the first step in SPSS after opening the application according to the video?

    -The first step is to go to the 'Variable View' in SPSS and input the variable names and labels.

  • How does the presenter suggest checking if the data is complete?

    -The presenter suggests checking the completeness of the data by ensuring there are 30 respondents and verifying the data in the 'Data View'.

  • Which statistical test is demonstrated in the video?

    -The video demonstrates the descriptive statistics test in SPSS.

  • What specific descriptive statistics are highlighted in the video?

    -The video highlights mean, standard deviation, minimum, and maximum values for the variables.

  • What does the presenter do with the output from the descriptive statistics test?

    -The presenter copies the output from the descriptive statistics test into a table for easier interpretation.

  • How is the interpretation of the descriptive statistics described?

    -The interpretation is described by discussing the minimum, maximum, mean, and standard deviation values for each variable.

  • What advice does the presenter give regarding the interpretation of data?

    -The presenter advises simplifying the interpretation and adjusting it as needed for clarity and completeness.

Outlines

00:00

📊 Data Preparation and Descriptive Statistics in SPSS

This paragraph demonstrates the process of preparing respondent data and conducting descriptive statistics using SPSS. The speaker provides a step-by-step guide on how to input data into the software, label variables (X1 for price, X2 for product quality, and Y for consumer loyalty), and copy data from respondents. The focus is on ensuring the data is complete before moving on to analysis. The speaker then describes how to navigate to the 'Analyze' section in SPSS, select 'Descriptive Statistics', and input the appropriate options to calculate measures such as mean, standard deviation, maximum, and minimum values. The output is presented in a table format, and the speaker emphasizes the importance of interpreting these results to understand the general picture of the data, including the distribution of values for each variable.

05:01

🔍 Interpreting Descriptive Statistics Results

The second paragraph continues the discussion on data analysis, focusing on interpreting the results of descriptive statistics. The speaker simplifies the interpretation by providing examples of how to describe the minimum, maximum, average, and standard deviation values for each variable, using hypothetical data for illustration. For instance, the minimum and maximum values for the price variable (X1) are given, along with the average and standard deviation. The same approach is suggested for interpreting the product quality (X2) and consumer loyalty (Y) variables. The speaker also mentions the importance of presenting this information in a clear and concise manner, possibly in a table, to avoid confusion. The paragraph concludes with a reminder that the video is specifically about descriptive statistics and an apology for any background noise during the recording, hinting at the video's production context.

Mindmap

Keywords

💡Respondent Data

Respondent data refers to the information collected from individuals who are participating in a study or survey. In the context of the video, the speaker is instructing viewers on how to prepare respondent data for analysis using SPSS. The script mentions 'menyiapkan data responden' which translates to 'preparing respondent data', indicating that this is a fundamental step in the video's tutorial on statistical analysis.

💡Variables

Variables are the traits or characteristics that are measured or observed in a study. The video script discusses 'tiga variabel' which means 'three variables', specifically 'variabel x' (independent variables) and 'variabel y' (dependent variable). The script uses 'X1' for price, 'X2' for product quality, and 'Y' for consumer loyalty as examples, demonstrating how to label and handle different types of variables within SPSS.

💡SPSS

SPSS, which stands for Statistical Package for the Social Sciences, is a software used for statistical analysis in various fields. The video's theme revolves around using SPSS to analyze respondent data. The script provides step-by-step instructions on how to input and manipulate data within the SPSS 'Variable View' and 'Data View', highlighting its importance in the data analysis process.

💡Descriptive Statistics

Descriptive statistics are used to summarize and organize the characteristics of a set of data. The video script mentions 'uji statistik deskriptif' which translates to 'descriptive statistical test'. The speaker guides viewers on how to perform this type of analysis in SPSS to understand the general picture of the data, including measures like mean, standard deviation, and range.

💡Mean

The mean, often referred to as the average, is a measure of central tendency in statistics. The script provides an example of calculating the mean for the variables 'harga' (price), 'kualitas produk' (product quality), and 'loyalitas konsumen' (consumer loyalty), indicating that the mean helps to understand the average value of these variables among respondents.

💡Standard Deviation

Standard deviation is a measure that indicates how spread out the values in a data set are. In the script, 'standar deviasinya' refers to the standard deviation of the variables. It is used to understand the variability or dispersion of the data points around the mean, with a higher standard deviation indicating more variability.

💡Minimum and Maximum

The minimum and maximum values represent the lowest and highest values in a data set, respectively. The video script discusses these terms in relation to the variables 'harga', 'kualitas produk', and 'loyalitas konsumen', showing how to identify the range of data by finding the minimum and maximum values.

💡Data Interpretation

Data interpretation involves making sense of data and drawing conclusions from it. The video script includes phrases like 'interpretasi dari hasil' which means 'interpretation of results'. The speaker explains how to interpret the descriptive statistics output, such as mean, standard deviation, minimum, and maximum values, to understand the distribution and characteristics of the respondent data.

💡Data View

In SPSS, 'Data View' is the mode where data is entered and viewed in a spreadsheet-like format. The script instructs viewers to switch to 'Data View' to copy and paste data, emphasizing the importance of this view for data manipulation and analysis.

💡Variable View

In SPSS, 'Variable View' is where variables are defined and managed. The script mentions 'buka aja aplikasi SPSS kalian ke variabel viewnya', which translates to 'open your SPSS to the variable view', indicating that this is where viewers should input variable names and labels for their data analysis.

Highlights

Introduction to preparing respondent data in SPSS.

Explanation of creating an example dataset with three variables, X1, X2, and Y.

Guidance on opening the Variable View in SPSS and entering variable names.

Instructions on labeling variables with appropriate titles such as 'harga', 'kualitas produk', and 'loyalitas konsumen'.

Demonstration of copying data from individual respondent statements to the SPSS Data View.

Process of checking data completeness with 30 respondents as an example.

Moving to the Analysis menu to perform descriptive statistical analysis.

Selection of descriptive statistics options in SPSS.

Inclusion of measures such as mean, standard deviation, maximum, and minimum values.

Continuing the analysis and closing the SPSS dialog box.

Interpretation of the descriptive statistical results.

Presentation of the results in a table format for easy understanding.

Detailed interpretation of variable X1 (harga) with minimum, maximum, mean, and standard deviation values.

Explanation of the distribution of the 'harga' variable based on the collected data.

Moving on to interpret variable X2 (kualitas produk) with similar descriptive statistics.

Presentation of the 'kualitas produk' variable's descriptive statistics including minimum, maximum, mean, and standard deviation.

Brief mention of the next steps after interpreting variable Y (loyalitas konsumen).

Final thoughts on the importance of understanding descriptive statistical analysis for research.

Encouragement for viewers to like, subscribe, and share the video for further assistance.

Transcripts

play00:00

hai hai

play00:01

[Musik]

play00:14

halo halo semuanya jadi seperti biasa

play00:17

kita harus menyiapkan data responden

play00:19

kita terlebih dahulu jadi ini contoh

play00:22

data aku gitu ya kalian nanti sesuai in

play00:26

aja dengan data kalian di sini aku

play00:29

mencontohkannya itu tiga variabel dua

play00:32

variabel x dan satu variabel y ini yang

play00:35

buat contoh aja gitu ya guys kemudian

play00:38

kalian buka aja aplikasi SPSS kalian ke

play00:41

variabel viewnya dan disini kalian tulis

play00:44

aja X1 kalian F2 dan juga yee atau

play00:48

sesuai dengan variabel kalian Nah untuk

play00:51

di label ini kalian tulis aja judul dari

play00:54

variabel kalian misalkan di sini aku kan

play00:57

X Satunya harga gitu kan X 2-nya

play01:00

kualitas produk dan variabel yaitu

play01:04

variabel

play01:05

Hai loyalitas konsumen Ya udah nanti aku

play01:08

masukkin Begitu juga dengan

play01:10

kalian-kalian masukin aja gitu ya di

play01:13

sini aku ketik dulu disini nulisnya

play01:16

harga kemudian disini kualitas produk

play01:18

kemudian yang yay itu adalah loyalitas

play01:21

konsumen

play01:24

Hai Nah kalau misalkan udah seperti ini

play01:27

ya udah balik lagi ke data viewnya

play01:29

karena tampilannya seperti ini kalian

play01:32

copy hasil dari total masing-masing

play01:36

responden per

play01:39

indikatornya atau pernyataannya yang

play01:42

udah di jumlah ini seperti ini ya gaes

play01:43

kini kalian copy gitu kan

play01:47

kopi aja ke bawah

play01:52

Hai kemudian

play01:54

psdx fesesnya di sini kita PES atau

play01:59

paste Ya begitu juga untuk yang X2 nya

play02:02

di sini aku juga copy kemudian aku taruh

play02:07

di sini dan untuk dianya juga lakukan

play02:11

hal yang sama gitu ya guys dicopy dulu

play02:14

yang mienya

play02:17

kemudian kita taruh di sini

play02:23

Hai nah Biasanya aku selalu mengecek

play02:26

Apakah datanya sudah komplit atau belum

play02:28

di sini ada 30 responden ya buat contoh

play02:30

aja Nah langsung aja ke ujiannya yaitu

play02:33

ke analis kemudian Nanti kalian pilih

play02:36

yang deskriptif statistik kemudian pilih

play02:38

yang

play02:39

deskriptif inilah gitu ya tuh aku meh

play02:42

kode yang ketiga-tiganya ini kalian

play02:45

masukin aja ke kanan Nah untuk yang

play02:47

disini

play02:49

udah seperti yang sesuai dengan opsi

play02:52

nyala ya Ada mint muda standard

play02:55

deviation maksimum-minimum ini udah gitu

play02:58

continue aja Nah di sini juga ga usah

play03:02

Yah kita close kemudian kita pilih oke

play03:06

nah Ini adalah hasil output nya aku

play03:09

besarin dulu ini hasil outputnya Emang

play03:12

segini guys emang cuma satu tampil doang

play03:14

gitu kan karena kan kita mau mencari uji

play03:18

statistik deskriptif gitu kan Nah ini

play03:21

nanti yang yang kita interpretasikan

play03:24

atau kita apa ya aku kopi dibawa itu

play03:28

nanti ya Nah untuk interpretasi dari

play03:31

hasil uji statistik deskriptif disinikan

play03:33

pengukuran ini akan dilakukan untuk

play03:36

melihat gambaran data secara umum

play03:38

seperti nilai-nilai rata-rata tomin gitu

play03:41

kan nilai tertinggi terendah dan standar

play03:44

devisiasi dari masing-masing variabel

play03:45

disini variabelnya kan tadi harga

play03:48

sebagai X1 kualitas produk F2 dan

play03:51

loyalitas konsumen yay gitu kan mengenai

play03:53

hasil uji statistik deskriptif

play03:56

penelitian dapat dilihat pada tabel

play03:58

berikut gitu kan

play04:00

Nah untuk tabel ini itu aku tadi udah

play04:04

copy ya guys sebelumnya dari hasil

play04:06

output yang ini jadi biar mudah lah biar

play04:10

enggak bolak-balik gitu kan jadi aku

play04:12

copy kemudian aku flash di sini

play04:14

nah yang dibawa ini langsung aja kalian

play04:16

interpretasi misalkan berdasarkan hasil

play04:19

uji deskriptif diatas dapat kita

play04:22

Gambarkan distribusi Hai yang didapat

play04:24

oleh peneliti adalah enggak variabel

play04:27

harga tf1 kalian ya udah lihat aja di

play04:29

ini gitu kan itu data tersebut ya

play04:33

nilai minimumnya 27 sedangkan nilai

play04:37

maksimumnya itu 39 dan rata-ratanya itu

play04:41

ya tiga 3,2 667 gitu kan standar

play04:47

devisiasi itu 2,9

play04:50

8194

play04:51

kalian parah groovin' ajalah seenak kan

play04:55

kalian ini kayaknya aku mau ganti dulu

play04:56

deh Biar lebih enak jatuhkan paragrafnya

play05:00

ini interpretasi secara sederhananya aja

play05:04

ya guys Jadi kalau misalnya Kalian mau

play05:06

menambahkan menambahkan gitu ya amat

play05:08

sangat dipersilahkan ini interpretasi

play05:11

secara sederhana

play05:14

Hai di sini aku ganti-ganti dulu biar

play05:17

satu paragraf atau satu kalimat aja gitu

play05:21

kan Nah mungkin kayak gini aja cukup

play05:23

kali ya

play05:24

Nah selanjutnya ya lakukan ke variabel

play05:28

X2 kalian Gitu kan di sini variabel X2

play05:31

nya itu kualitas produk Ya udah tulis

play05:33

aja kualitas produk atau X2

play05:36

biar enggak pusing gitu kan

play05:39

untuk interpretasinya juga sama dari

play05:42

data tersebut bisa dideskripsikan bahwa

play05:45

nilai minimumnya itu berapa maksimum

play05:48

yaitu Berapa nilai rata-ratanya berapa

play05:51

dan standar deviasinya berapa ada di

play05:53

tabel kalian bisa lihat aja tampilnya

play05:56

gitu nah disini minumnya itu 27 juga

play06:00

sedangkan

play06:04

the maximum Itu Disini

play06:09

hai hai

play06:11

hai hai

play06:13

[Musik]

play06:15

Hai sebesar 46

play06:19

Hai dan nilai rata-ratanya disini

play06:23

nilai rata-rata kualitas produk ya guys

play06:26

sebesar 32 kalian bisa lihat tabel ini

play06:31

biar nggak bingung gitu kan minyaknya

play06:34

sudah yang ini

play06:41

ke-67 dan standard deviation yaitu yang

play06:46

udah tulis aja gitu kan udah dari tabel

play06:48

gitu

play06:50

hai hai

play06:53

Hai

play06:54

3,57 sekian

play07:00

235

play07:02

7858 yang ini ya guys

play07:05

Nah mungkin ini cukup kali ya

play07:07

interpretasi yang sederhananya lah

play07:09

lakukan lagi sama hal yang sama untuk di

play07:14

variabel y kalian Gitu kan dan disini

play07:17

dia itu kan loyalitas konsumen kan

play07:19

Yaudah sama aja interpretasinya tinggal

play07:21

masuk masukin angka-angkanya aja

play07:23

gitu ya guys

play07:26

di sini aku percepat ya

play07:30

I don't want maaf banget kalau misalkan

play07:32

di sini ada suara hangeng karena ya aku

play07:35

ambil video ini di hari weekend jadi ya

play07:38

uang menganggap di sebelah rumah itu

play07:41

adalah bengkel mobil

play07:45

Oke kalau misalkan kalian udah gitu kan

play07:48

udah

play07:49

menginterpretasikan nyampe variabel y

play07:51

kalian

play07:52

ya sudah nanti kalian lanjut ke uji

play07:55

berikutnya gitu kan Nah untuk video kali

play07:58

ini atau video ini ya khusus untuk uji

play08:00

statistik deskriptif aja

play08:03

ini aku tulis dulu udah selesai ini

play08:06

lihatnya ini a standard deviation nya

play08:08

aku tadi lupa jadi ini belum lengkap

play08:11

gitu kan

play08:12

3086

play08:14

4.0 cache jadi ini adalah

play08:18

hasil uji statistik deskriptif beserta

play08:22

interpretasinya Semoga bisa dipahami

play08:26

bisa bermanfaat juga buat teman-teman

play08:28

semua dan lupa kalau misalkan Enno video

play08:32

ini bermanfaat Jangan lupa bantu like

play08:34

subscribe dan share ke media sosial

play08:37

kalian sebanyak-banyaknya Terima kasih

play08:39

sampai jumpa di videoku selanjutnya bye

play08:42

bye

play08:44

[Musik]

Rate This

5.0 / 5 (0 votes)

Étiquettes Connexes
SPSS TutorialData PreparationDescriptive StatisticsStatistical AnalysisResearch MethodsData InterpretationRespondent DataVariable AnalysisEducational ContentResearch Tools
Besoin d'un résumé en anglais ?