Confidence Interval [Simply explained]
Summary
TLDRThis tutorial explains the concept of confidence intervals in statistics. It highlights how parameters of a population, such as the mean or variance, are estimated using a sample, since surveying an entire population is often not feasible. The video introduces the formula for calculating confidence intervals, including the commonly used 95% confidence level, and discusses how the true population parameter lies within a range with a certain probability. It also covers the normal distribution curve and the significance of the set value for calculating the confidence interval, with practical examples. The tutorial aims to simplify understanding for viewers.
Takeaways
- 😀 Confidence intervals estimate population parameters based on sample data.
- 😀 Since it's often impractical to survey the entire population, samples are used to make inferences about the population.
- 😀 The population parameter, such as the mean or variance, is typically estimated from the sample's mean.
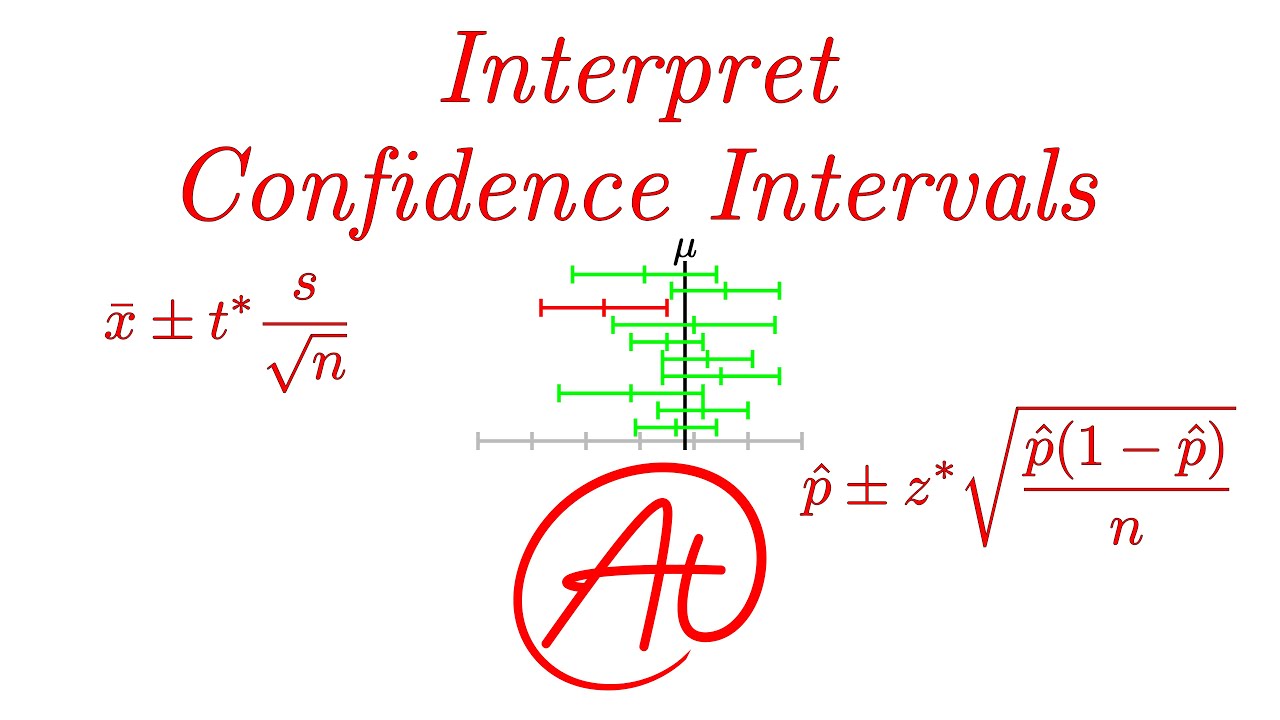
- 😀 Drawing multiple samples will likely produce slightly different sample means due to random variation.
- 😀 Confidence intervals help determine a range in which the true population parameter is likely to fall.
- 😀 A common confidence level used is 95%, meaning there is a 95% chance that the true parameter lies within the interval.
- 😀 For normally distributed data, the confidence interval formula is: x̄ ± z * (s/√n).
- 😀 In the formula, x̄ represents the sample mean, z is the z-value for the selected confidence level, s is the standard deviation, and n is the sample size.
- 😀 The z-value for a 95% confidence level is 1.96, meaning the equation becomes: x̄ ± 1.96 * (s/√n).
- 😀 Confidence intervals can be calculated for various statistical parameters, not just the mean.
- 😀 The confidence interval provides a range that gives a specific probability (e.g., 95%) that the true parameter lies within it.
Q & A
What is a confidence interval in statistics?
-A confidence interval is a range within which the true value of a population parameter is likely to fall, based on a sample. It provides an estimate with a certain probability, such as 95% or 99% confidence, about where the true parameter lies.
Why do we use a sample to estimate population parameters?
-We use a sample because surveying the entire population is often impractical. A sample allows us to estimate population parameters, such as the mean or variance, with a level of confidence.
How does drawing multiple samples help in estimating a population parameter?
-When drawing multiple samples, each sample will likely give a slightly different mean. This variation allows us to understand the range in which the true population parameter is likely to be found.
What does it mean to say a confidence interval is 95%?
-A 95% confidence interval means that if we were to draw many samples, 95% of the intervals calculated from those samples would contain the true population parameter.
How do we calculate a confidence interval for a normally distributed population?
-For normally distributed data, the confidence interval for the mean is calculated using the formula: x̄ ± z * (s / √n), where x̄ is the sample mean, z is the z-value corresponding to the desired confidence level, s is the sample standard deviation, and n is the sample size.
What is the significance of the 'z' value in the confidence interval formula?
-The 'z' value, also called the z-score, corresponds to the desired confidence level. For a 95% confidence level, the z-value is typically 1.96. This value is used to calculate the upper and lower limits of the confidence interval.
How do we visualize a confidence interval on a normal distribution curve?
-The confidence interval is represented as a range on the normal distribution curve. The lower limit is calculated by subtracting the margin of error (z * s / √n) from the sample mean, while the upper limit is calculated by adding the margin of error to the sample mean.
What does it mean to say that 95% of all values lie within a confidence interval?
-It means that if we were to repeatedly sample from the population, 95% of the confidence intervals calculated from those samples would contain the true population mean.
Where do we find the z-value for a given confidence level?
-The z-value for a given confidence level can be found in a statistical table that lists z-scores corresponding to specific confidence levels, such as 95% or 99%.
Can confidence intervals be used for other statistical parameters besides the mean?
-Yes, confidence intervals can be calculated for various statistical parameters, not just the mean. For example, they can be used to estimate population variance or proportion.
Outlines

Cette section est réservée aux utilisateurs payants. Améliorez votre compte pour accéder à cette section.
Améliorer maintenantMindmap

Cette section est réservée aux utilisateurs payants. Améliorez votre compte pour accéder à cette section.
Améliorer maintenantKeywords

Cette section est réservée aux utilisateurs payants. Améliorez votre compte pour accéder à cette section.
Améliorer maintenantHighlights

Cette section est réservée aux utilisateurs payants. Améliorez votre compte pour accéder à cette section.
Améliorer maintenantTranscripts

Cette section est réservée aux utilisateurs payants. Améliorez votre compte pour accéder à cette section.
Améliorer maintenantVoir Plus de Vidéos Connexes


5.0 / 5 (0 votes)
