Tutorial Membuat DFD (Data Flow Diagram) | Studi Kasus Koperasi
Summary
TLDRIn this tutorial, the creator walks viewers through the process of creating a Data Flow Diagram (DFD) for a cooperative savings and loan system. Starting with a detailed case study of a cooperative managing member loans, the video explains how to construct a DFD by breaking down the system into key components: the system, external entities (members and cooperative managers), data flows, and business processes. The tutorial covers the creation of a context diagram, a Level 0 diagram, and a Level 1 detailed diagram, providing a clear and structured approach to visualizing complex information systems.
Takeaways
- 😀 The video focuses on how to create a Data Flow Diagram (DFD) for a cooperative's loan management system.
- 😀 The case study involves a cooperative that manages loans for its members, including loan applications, payment processing, and reporting.
- 😀 The DFD creation process starts with understanding the system, external entities, data flows, and business processes involved.
- 😀 The first step in creating a DFD is making the context diagram, which includes defining the system, identifying external entities, and mapping out data flows.
- 😀 In this case study, the external entities are the 'Members' and the 'Head of Cooperative,' while the system is the 'Loan Management System.'
- 😀 Data flows include loan request forms, loan proof documents, payment data, and reports for the cooperative's head.
- 😀 The system's processes are divided into three main categories: Loan Process, Payment Process, and Reporting Process.
- 😀 In the Level 0 DFD, the system is broken down into three core processes: 1) Loan Application, 2) Payment Processing, and 3) Report Generation.
- 😀 The Level 1 DFD provides more detail on each process, showing input, output, and intermediate data stores such as loan and payment records.
- 😀 The video outlines how each process (Loan Application, Payment Processing, Report Generation) involves specific activities like recording data, generating documents, and storing information.
- 😀 The goal of this video is to guide viewers in creating a clear and structured DFD to understand and manage complex systems like loan processing in cooperatives.
Q & A
What is the primary objective of the video tutorial?
-The primary objective of the tutorial is to teach viewers how to create a Data Flow Diagram (DFD) for a case study involving a cooperative's savings and loan management system.
What are the four key elements to understand before creating a DFD?
-The four key elements are: the system being developed, the external entities involved, the data flows within the system, and the business processes that occur within the system.
What external entities are involved in the cooperative's loan system?
-The external entities are the 'Members' (who request loans and make payments) and the 'Cooperative Head' (who receives reports on loan and payment statuses).
What types of data are flowing through the cooperative’s loan system?
-The data flowing through the system includes loan application forms, loan receipts, payment records, and monthly loan and payment reports.
What are the three major business processes in the system?
-The three major processes are: 1) Loan Application Process, 2) Loan Payment Process, and 3) Report Generation Process.
How does the loan application process work according to the script?
-In the loan application process, members submit loan application forms (Formulir PP), which are recorded and stored in the system. The system then generates a loan receipt to provide to the member.
What is the role of the 'Cooperative Head' in the system?
-The 'Cooperative Head' receives monthly reports on loan status and payment status, which are generated by the system based on data stored in the system's records.
How does the loan payment process work in the system?
-In the loan payment process, members submit their monthly installment payments, which are recorded in the system. The system then generates payment receipts for the members.
What is the significance of the 'Level 0' diagram in creating a DFD?
-The 'Level 0' diagram provides a high-level overview of the system, breaking it down into its core processes (loan application, loan payment, and report generation), external entities (members and cooperative head), and data flows.
How is the 'Level 1' diagram different from the 'Level 0' diagram?
-The 'Level 1' diagram is a more detailed breakdown of the processes shown in the 'Level 0' diagram. It includes specific sub-processes within each major process, such as recording loan applications or generating loan receipts.
Outlines

Cette section est réservée aux utilisateurs payants. Améliorez votre compte pour accéder à cette section.
Améliorer maintenantMindmap

Cette section est réservée aux utilisateurs payants. Améliorez votre compte pour accéder à cette section.
Améliorer maintenantKeywords

Cette section est réservée aux utilisateurs payants. Améliorez votre compte pour accéder à cette section.
Améliorer maintenantHighlights

Cette section est réservée aux utilisateurs payants. Améliorez votre compte pour accéder à cette section.
Améliorer maintenantTranscripts

Cette section est réservée aux utilisateurs payants. Améliorez votre compte pour accéder à cette section.
Améliorer maintenantVoir Plus de Vidéos Connexes

What is DFD ? Full Explained With Example Library Management System DFD | Don't Miss

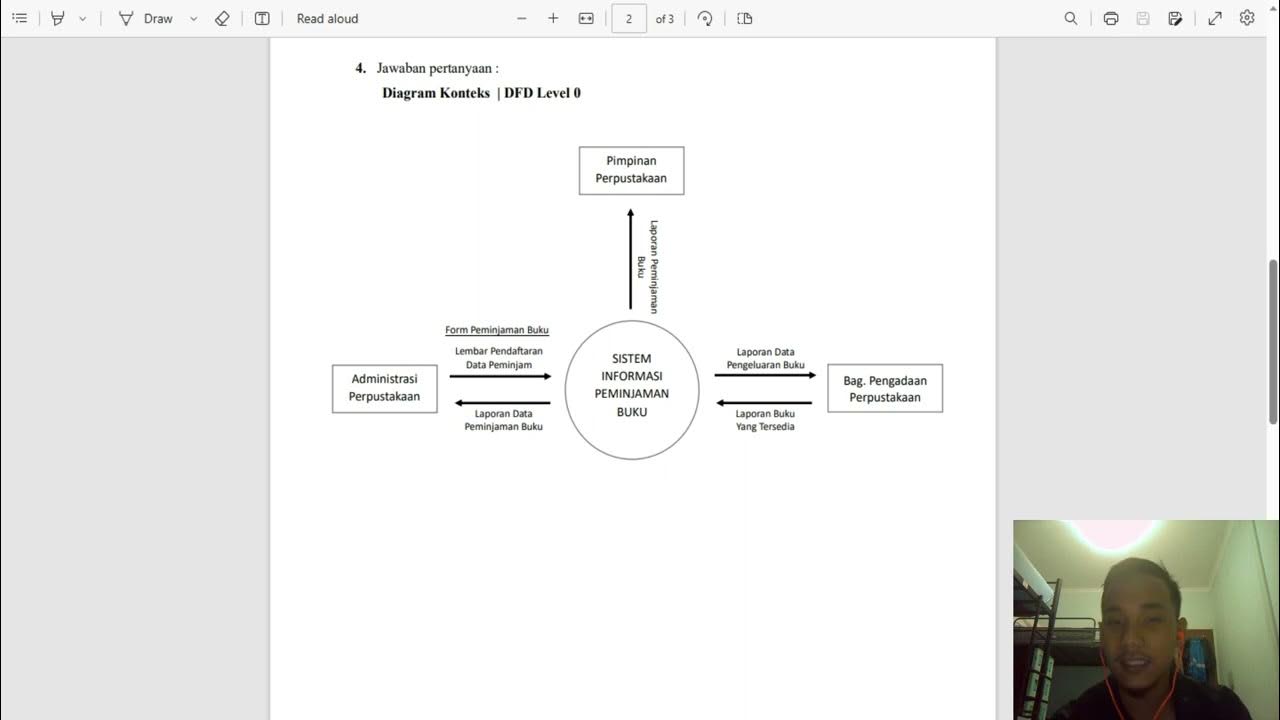
Diagram Konteks | DFD Level 0 dan DFD Level 1 | Sistem Informasi Peminjaman Buku

Data Flow Diagram (DFD): Definisi, Sejarah, Notasi, Tahap dan Tipsnya.

Data Flow Diagram Level 0 | Analisis dan Desain Sistem

Chapter 7 Session 4 Part II: Stonehurst Place Example: Connecting Human Interfaces and DFD-0

Belajar Sistem Informasi | 5. Mengenal Data Flow Diagram (DFD)
5.0 / 5 (0 votes)
