Local Spatial Autocorrelation - A Course on Geographic Data Science
Summary
TLDRThis video explores local spatial autocorrelation, a method for identifying patterns in spatial data by analyzing relationships between neighboring values. Unlike global spatial autocorrelation, which aggregates data into a single value, local spatial autocorrelation zooms in on smaller map sections to detect clusters or outliers. The video introduces the concept of Local Indicators of Spatial Association (LISAs), which measure the strength of these local patterns. Key types of spatial autocorrelation discussed include high-high, low-low, high-low, and low-high correlations, each revealing unique spatial relationships useful in various fields like urban planning and geography.
Takeaways
- 😀 Local spatial autocorrelation (LSA) focuses on identifying patterns at a finer, localized scale, as opposed to global spatial autocorrelation (GSA) which summarizes entire maps.
- 😀 LSA is about detecting clusters or pockets of spatial heterogeneity, where values correlate strongly and specifically in certain parts of the map.
- 😀 Global spatial autocorrelation distills the entire pattern of the map into a single value, whereas LSA augments the data by analyzing each observation individually.
- 😀 LSA tests for local clustering and does not summarize the map. Instead, it explores patterns in specific regions and identifies outliers or clusters at a granular level.
- 😀 The high-high class in LSA refers to areas with high values surrounded by high values, commonly referred to as hotspots.
- 😀 The low-low class represents areas with low values surrounded by low values, also known as cold spots in the literature.
- 😀 High-low areas in LSA occur when high values are surrounded by low values, often considered spatial outliers.
- 😀 Low-high areas are the opposite of high-low, where low values are surrounded by high values, sometimes described informally as 'donut' patterns.
- 😀 LISA (Local Indicators of Spatial Association) is a statistical method used to operationalize LSA and detect spatial clusters or patterns in local data.
- 😀 LISA is a family of statistics, and the specific test covered in the course is the local version of Moran's I, used for detecting local spatial autocorrelation.
- 😀 Unlike Moran’s I, which gives a single summary statistic, LISA runs a test for every observation in the dataset, assessing how each observation deviates from the overall spatial trend.
Q & A
What is the main difference between local and global spatial autocorrelation?
-The main difference is that global spatial autocorrelation, like Moran's I, summarizes the entire map into a single value, while local spatial autocorrelation examines each observation individually to assess how it relates to its neighbors in the context of spatial clustering.
What are the key goals of local spatial autocorrelation?
-The key goal of local spatial autocorrelation is to identify specific clusters or patterns within a spatial dataset where the relationship between values and location is particularly strong, which can reveal localized trends and anomalies.
What types of patterns can be identified through local spatial autocorrelation?
-The four key patterns of local spatial autocorrelation are High-High (hotspots), Low-Low (cold spots), High-Low (spatial outliers), and Low-High (spatial outliers). These patterns describe how values are distributed in relation to their neighbors.
How does local spatial autocorrelation help in exploring data?
-Local spatial autocorrelation helps by zooming in on smaller regions of a map, identifying areas where there are strong spatial associations between values and their locations, which could lead to a better understanding of spatial phenomena.
What is the significance of LISA in local spatial autocorrelation?
-LISA, or Local Indicators of Spatial Association, is a statistical test that detects spatial clusters or sections of a map with particular patterns. It allows the examination of spatial relationships on a local level, offering a detailed view compared to global measures like Moran's I.
How does LISA differ from Moran's I?
-LISA differs from Moran's I in that it tests each observation individually for its spatial association with neighboring data points, while Moran's I summarizes the entire map into a single statistic.
What is meant by 'high-high' in local spatial autocorrelation?
-'High-high' refers to areas where high values are surrounded by other high values, indicating a positive spatial correlation where similar values cluster together. This is commonly referred to as a 'hotspot'.
What does 'low-low' indicate in the context of local spatial autocorrelation?
-'Low-low' indicates areas where low values are surrounded by other low values, suggesting a positive spatial correlation among low-value observations, often referred to as 'cold spots'.
What are 'high-low' and 'low-high' patterns in local spatial autocorrelation?
-'High-low' describes areas where high values are surrounded by low values, and 'low-high' describes areas where low values are surrounded by high values. Both are examples of spatial outliers, where the data deviates from the overall pattern.
How can LISA be used to assess the significance of local spatial autocorrelation?
-LISA allows for the calculation of statistical significance for each observation, helping to determine whether the spatial relationship between an observation and its neighbors is different from what would be expected under a random distribution of values.
Outlines

Cette section est réservée aux utilisateurs payants. Améliorez votre compte pour accéder à cette section.
Améliorer maintenantMindmap

Cette section est réservée aux utilisateurs payants. Améliorez votre compte pour accéder à cette section.
Améliorer maintenantKeywords

Cette section est réservée aux utilisateurs payants. Améliorez votre compte pour accéder à cette section.
Améliorer maintenantHighlights

Cette section est réservée aux utilisateurs payants. Améliorez votre compte pour accéder à cette section.
Améliorer maintenantTranscripts

Cette section est réservée aux utilisateurs payants. Améliorez votre compte pour accéder à cette section.
Améliorer maintenantVoir Plus de Vidéos Connexes

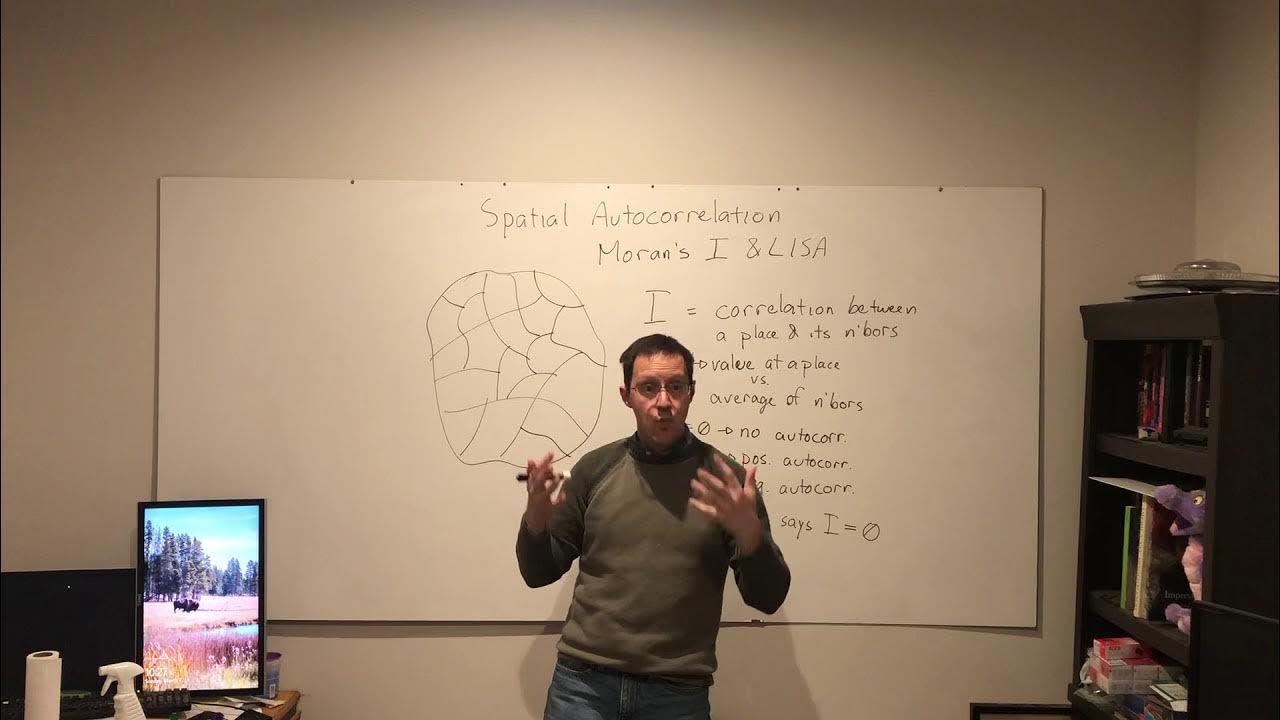
Statistical inference for spatial autocorrelation: Moran’s I & LISA

Spatial Sampling & Interpolation

Introduction to Spatial Statistics #GIS #Maps #Data Science

A "Crash Course" to Spatial Interpolation

Spatial Database Management System (SDBMS) - Spatial Data Science and Applications

GIS Module 11: Spatial Modeling
5.0 / 5 (0 votes)
