Why a "least squares regression line" is called that...
Summary
TLDRIn this video, the instructor explains the concept of the least squares regression line, demonstrating why it's called 'least squares.' By analyzing five data points, the instructor shows how the goal is to minimize the sum of squared residuals, the differences between the points and the line. Using a visual approach, the instructor illustrates how adjusting the line changes the squared error, with the optimal line minimizing this sum. The lesson highlights that while the least squares line finds the best fit, correlation is needed to evaluate how well the line represents the data.
Takeaways
- 😀 The least squares regression line is called 'least squares' because it minimizes the sum of the squared residuals (errors) between the data points and the line.
- 😀 Residuals are the vertical distances between data points and the line. These distances can be positive or negative.
- 😀 Squaring the residuals ensures that all errors are positive and penalizes larger errors more heavily.
- 😀 The goal is to minimize the sum of squared residuals to find the line that best fits the data.
- 😀 The best-fit line is determined by adjusting it until the sum of squared residuals is as small as possible.
- 😀 The correlation coefficient (R value) is a separate measure that tells you how well the line fits the data, beyond just minimizing the squared errors.
- 😀 The least squares regression method does not measure the strength of the fit directly; for that, you need to use correlation.
- 😀 It's important to visually inspect the data to see if a linear model fits well before applying least squares regression.
- 😀 A good understanding of residuals and squared errors is crucial to understanding why least squares regression works the way it does.
- 😀 The least squares regression line is not the only line that could fit the data, but it is the one that minimizes the squared differences between the data and the line.
- 😀 By adjusting the line manually in the example, you can observe how the sum of squared residuals changes, helping to visualize the fitting process.
Q & A
What is the main goal of the video?
-The goal of the video is to explain why the least squares regression line is called 'least squares' and to demonstrate how it is used to fit data points on a graph.
Why are the data points placed in the first quadrant of the coordinate plane?
-The data points are placed in the first quadrant to make them easier to visualize and to use simple, clear coordinates for better understanding.
What does it mean to check if the data looks 'linear'?
-Checking if the data looks 'linear' means determining whether the data points follow a pattern that can be described by a straight line, which is often the simplest model.
What is the challenge in choosing the best fit line for the data?
-The challenge is that there are many possible lines that could fit the data, and determining the one that best represents the relationship between the data points requires measuring the error of each potential line.
What are residuals, and why are they important?
-Residuals are the differences between the data points and the points on the regression line. They are important because they represent how far off the line is from the actual data, and minimizing these residuals is key to finding the best fit line.
Why do statisticians square the residuals instead of just adding them?
-Statisticians square the residuals to avoid cancellation between positive and negative errors and to ensure that larger errors are given more weight, allowing for a better representation of the overall fit.
What does the phrase 'least squares' refer to?
-'Least squares' refers to the method of minimizing the sum of the squared residuals in order to find the best fitting regression line. This minimizes the error in the fit by reducing the total squared differences.
How does the process of minimizing the squared residuals work?
-Minimizing the squared residuals involves adjusting the regression line so that the sum of the squares of the vertical distances (errors) between the data points and the line is as small as possible.
Why is squaring the residuals crucial in finding the best fit line?
-Squaring the residuals is crucial because it ensures that all errors are treated as positive values, preventing cancellation and giving more emphasis to larger deviations from the line, which ultimately helps in finding the most accurate fit.
What is the role of the correlation (R value) in evaluating the regression line?
-The correlation (R value) measures how well the regression line fits the data. It helps determine whether using a line to model the data is appropriate and how well the line describes the relationship between the variables.
Outlines

Cette section est réservée aux utilisateurs payants. Améliorez votre compte pour accéder à cette section.
Améliorer maintenantMindmap

Cette section est réservée aux utilisateurs payants. Améliorez votre compte pour accéder à cette section.
Améliorer maintenantKeywords

Cette section est réservée aux utilisateurs payants. Améliorez votre compte pour accéder à cette section.
Améliorer maintenantHighlights

Cette section est réservée aux utilisateurs payants. Améliorez votre compte pour accéder à cette section.
Améliorer maintenantTranscripts

Cette section est réservée aux utilisateurs payants. Améliorez votre compte pour accéder à cette section.
Améliorer maintenantVoir Plus de Vidéos Connexes

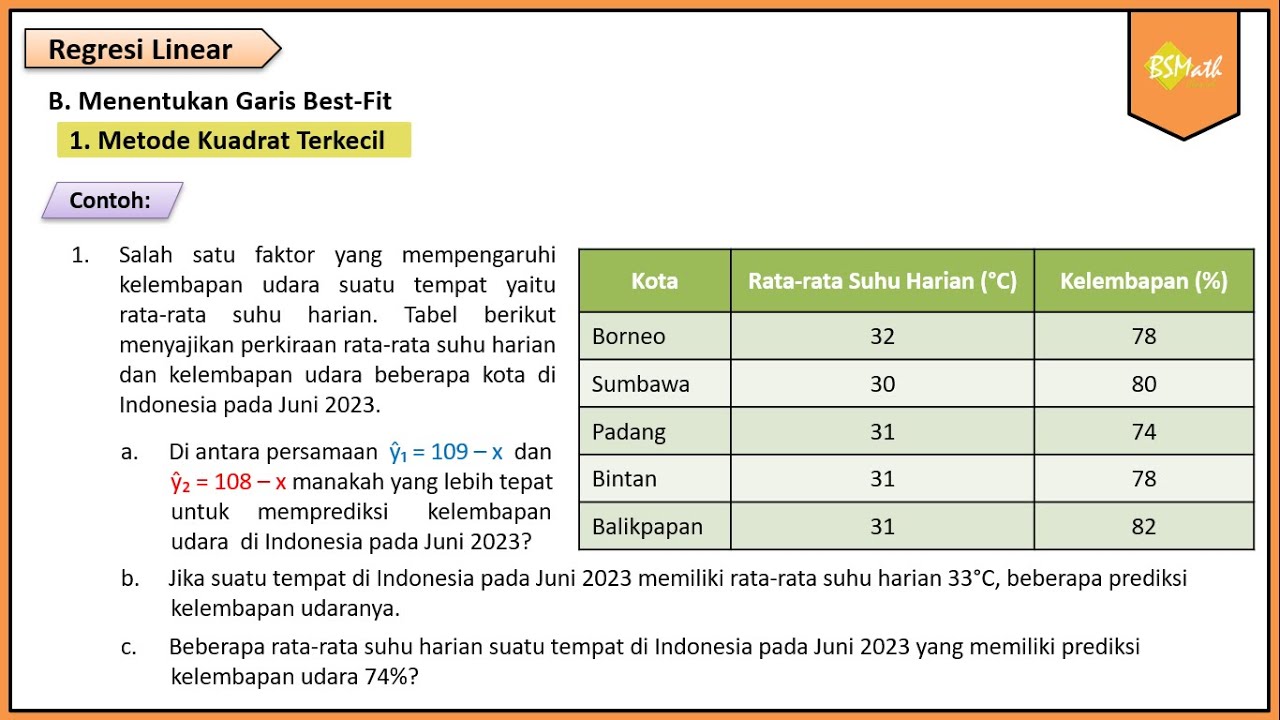
Metode Kuadrat Terkecil Hal 97-101 Bab 3 STATISTIK Kelas 11 SMA Kurikulum Merdeka
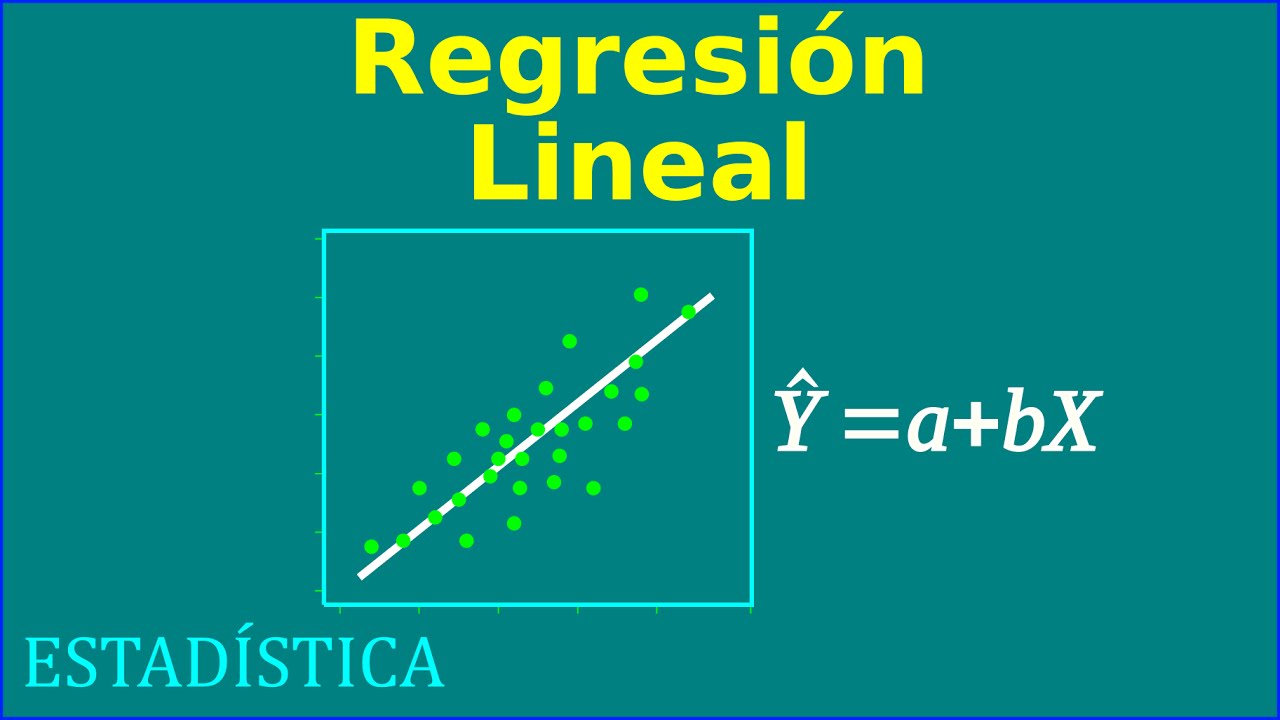
Regresion Lineal
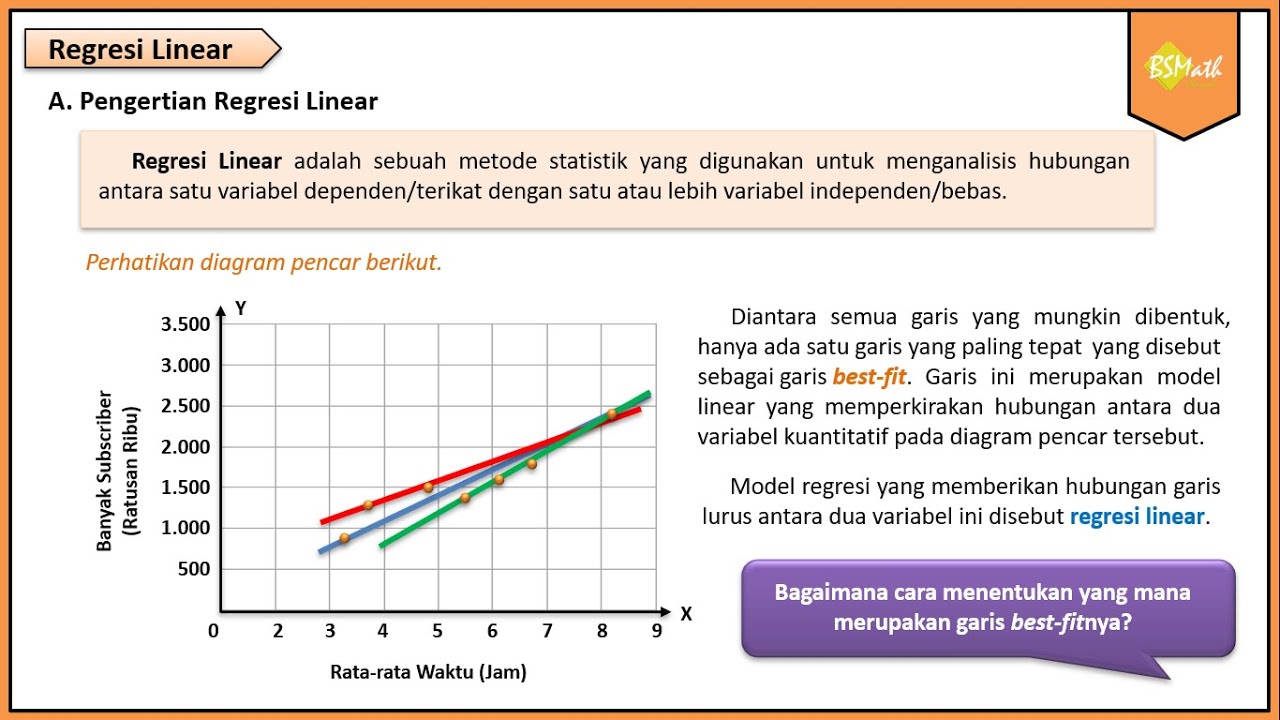
Pengertian Regresi Linear - Matematika Wajib Kelas XI Kurikulum Merdeka
Contoh Soal dan Pembahasan Metode Kuadrat Terkecil - Matematika Wajib Kelas XI Kurikulum Merdeka

Week 3 Lecture 14 Partial Least Squares

How to make Forecasting! | Quantitative Forecasting with Least Squares Method | Quickly & easily
5.0 / 5 (0 votes)
