t-distribution in Statistics and Probability | Statistics Tutorial #9 | MarinStatsLectures
Summary
TLDRThe t-distribution, developed by William Gossett for quality control at Guinness breweries, is used when the population standard deviation is unknown, requiring the use of sample standard deviation. It accounts for additional uncertainty in small sample sizes. Unlike the normal distribution, the t-distribution is wider, reflecting this uncertainty. As sample size increases, the t-distribution converges towards the normal distribution, becoming approximately the same for sample sizes over 120, and nearly identical for sizes over 200.
Takeaways
- 📊 The t-distribution is used when dealing with samples of data, especially when the population standard deviation is unknown.
- 🔄 It adjusts for the uncertainty introduced by using the sample standard deviation instead of the population standard deviation.
- 🍺 The t-distribution was developed by William Gossett while working at Guinness breweries and was published under the pseudonym 'Student'.
- 📉 The t-distribution accounts for small sample sizes and provides better estimates compared to the normal distribution in those cases.
- 🎓 As sample sizes increase, the t-distribution converges to the standard normal distribution.
- 📏 A t-distribution with larger degrees of freedom looks more similar to the normal distribution.
- 🔢 For sample sizes over 120, the t-distribution becomes nearly indistinguishable from the normal distribution.
- 🔍 When working with very large sample sizes, the difference between the t-distribution and the normal distribution becomes negligible.
- 💡 The t-distribution is essentially the normal distribution adjusted for sample data and uncertainty in standard deviation estimates.
- 🖥️ In practice, software is often used to perform calculations, so understanding the conceptual difference between t and z distributions is emphasized over manual calculations from tables.
Q & A
What is the main purpose of using the t-distribution instead of the z-distribution?
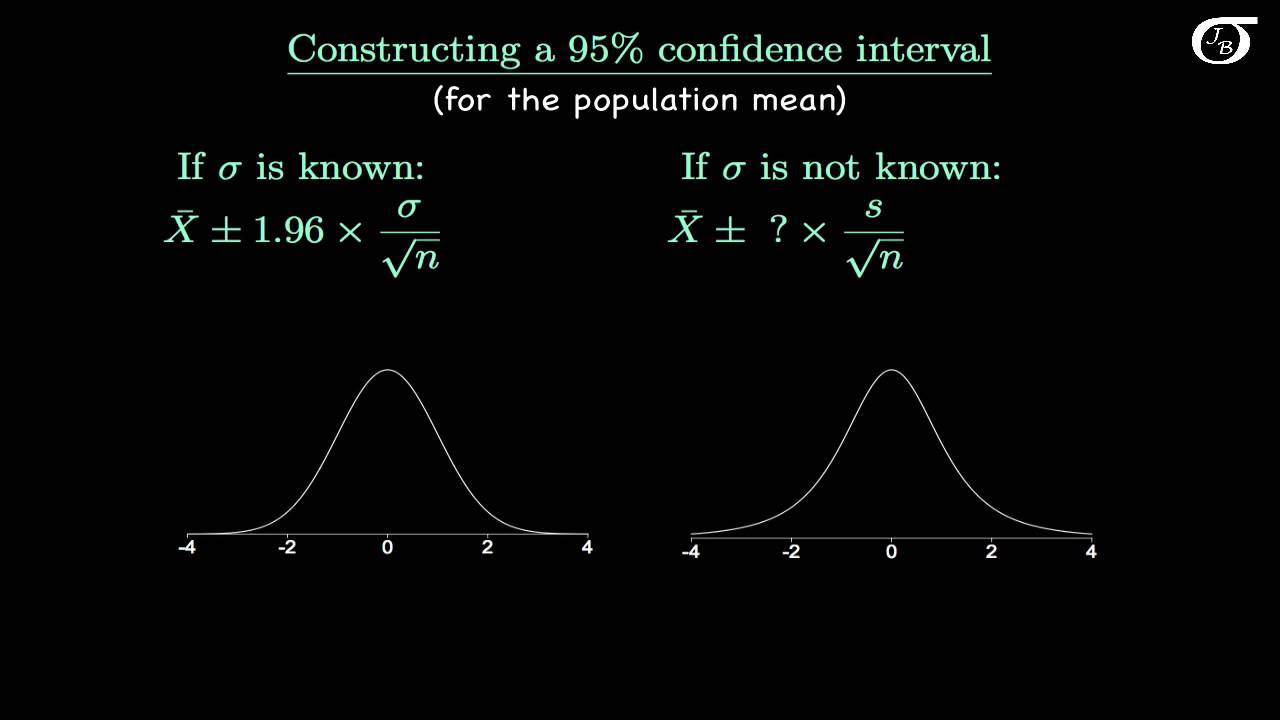
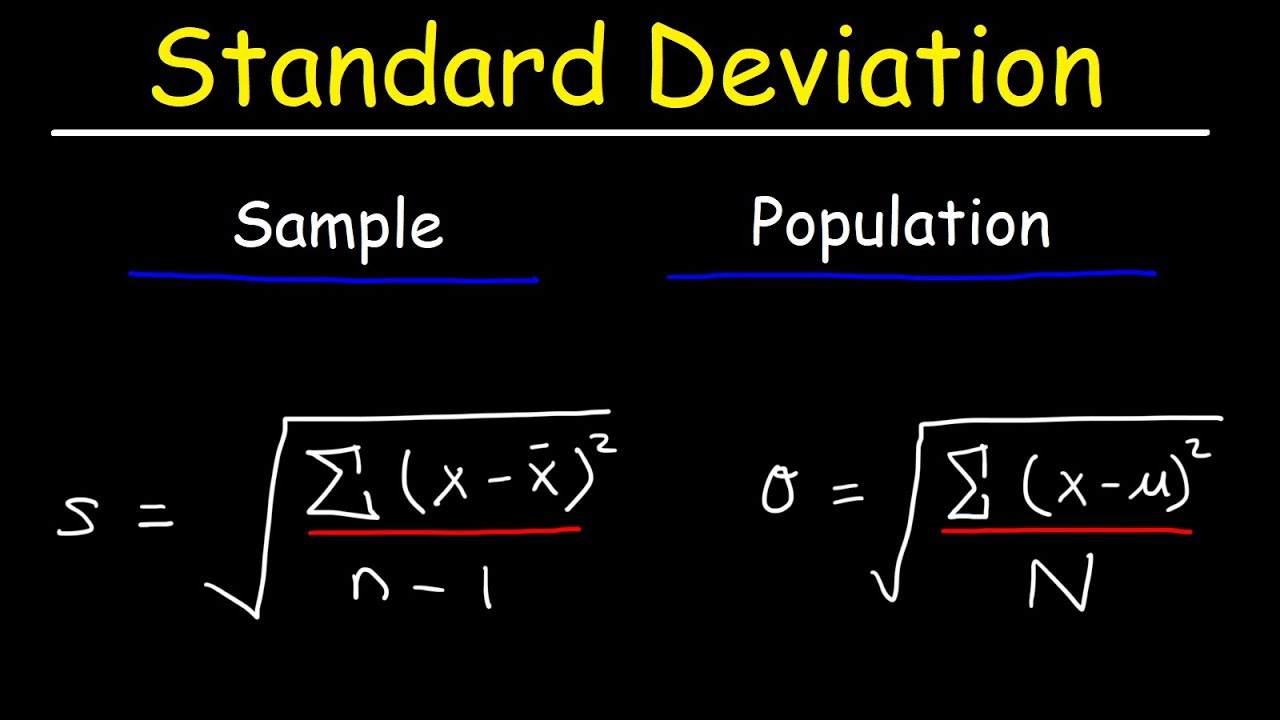
-The t-distribution is used instead of the z-distribution when the population standard deviation is unknown, and we have to estimate it using the sample standard deviation. It accounts for the extra uncertainty in the estimate.
Who developed the t-distribution and why?
-The t-distribution was developed by William Gossett while working on quality control at Guinness breweries. He noticed that using the normal distribution for small sample sizes led to underestimations and developed the t-distribution to correct for this.
Why is the t-distribution sometimes referred to as the 'Student's t-distribution'?
-Gossett’s work on the t-distribution was published under the pseudonym 'Student' because he worked for Guinness, and the company did not allow employees to publish under their real names.
How does the t-distribution differ from the standard normal distribution?
-The t-distribution is wider than the standard normal distribution to account for the extra uncertainty in estimating the population standard deviation using a sample. As sample size increases, the t-distribution approaches the normal distribution.
What happens to the t-distribution as the sample size increases?
-As the sample size increases, the t-distribution converges towards the standard normal distribution. Once the sample size exceeds 120, the difference between the t-distribution and the normal distribution becomes negligible.
What are degrees of freedom in the context of the t-distribution?
-Degrees of freedom refer to the number of independent values that are free to vary in the calculation of a statistic. In the t-distribution, degrees of freedom are typically related to the sample size (n - 1).
Why does the t-distribution become wider when the degrees of freedom are smaller?
-With smaller degrees of freedom, the t-distribution becomes wider because there is more uncertainty in estimating the population standard deviation from a smaller sample. The extra width accounts for this uncertainty.
At what sample size does the t-distribution become almost identical to the normal distribution?
-The t-distribution becomes almost identical to the normal distribution once the sample size exceeds 200.
Why is it often preferable to use software for t-distribution calculations?
-Using software for t-distribution calculations is preferable because it allows for precise calculations without having to manually look up values in a t-table, which can be time-consuming and may shift focus away from understanding the concepts.
What lesson did Gossett learn from his work on quality control with small samples?
-Gossett learned that using the normal distribution with small samples often led to underestimation because the sample standard deviation was not an accurate representation of the population standard deviation. This led him to develop the t-distribution to address the issue.
Outlines

Cette section est réservée aux utilisateurs payants. Améliorez votre compte pour accéder à cette section.
Améliorer maintenantMindmap

Cette section est réservée aux utilisateurs payants. Améliorez votre compte pour accéder à cette section.
Améliorer maintenantKeywords

Cette section est réservée aux utilisateurs payants. Améliorez votre compte pour accéder à cette section.
Améliorer maintenantHighlights

Cette section est réservée aux utilisateurs payants. Améliorez votre compte pour accéder à cette section.
Améliorer maintenantTranscripts

Cette section est réservée aux utilisateurs payants. Améliorez votre compte pour accéder à cette section.
Améliorer maintenantVoir Plus de Vidéos Connexes
Introduction to the t Distribution (non-technical)

Pemilihan statistik Z atau t
Confidence Interval Concept Explained | Statistics Tutorial #7 | MarinStatsLectures
Intervalo de Confiança para a MÉDIA (μ) com variância populacional desconhecida
Standard Deviation Formula, Statistics, Variance, Sample and Population Mean
Standard Error of the Mean: Concept and Formula | Statistics Tutorial #6 | MarinStatsLectures
5.0 / 5 (0 votes)
