Confidence Interval Concept Explained | Statistics Tutorial #7 | MarinStatsLectures
Summary
TLDRThis video explains how sampling distributions are used to create confidence intervals, focusing on a confidence interval for a single mean. The concept is illustrated using an example with systolic blood pressure data. It emphasizes the importance of the standard error, the 95% confidence rule, and how sample means relate to population means. The video also touches on the need to use sample data when the population standard deviation is unknown, and briefly introduces the transition from using a Z-score to a t-value when dealing with smaller samples.
Takeaways
- 📊 The concept of a sampling distribution is crucial for building a confidence interval, especially when focusing on a single mean.
- 📉 The video discusses a population with a skewed distribution, a mean of 125, and a standard deviation of 20, and how a sample of 25 can be used to estimate the mean.
- 📏 The sampling distribution of sample means is approximately normally distributed, with the sample mean equal to the population mean, and its standard deviation (standard error) calculated.
- 📐 The standard error of the mean is essential to understand how far, on average, the sample mean will deviate from the true population mean.
- 🔍 Using the 95% confidence rule (2 standard deviations), 95% of sample means will fall within this range of the population mean.
- 🔄 The same logic applies in reverse: 95% of the time, the true population mean will fall within 2 standard deviations of the sample mean.
- 👀 Visually, 95% of the sample means will produce intervals that contain the population mean, but 5% will not.
- 🔢 In practice, we replace the true population standard deviation with the sample standard deviation because the former is usually unknown.
- 📈 Instead of using the Z-distribution, the T-distribution is used for small samples, resulting in slightly larger critical values.
- ✅ Confidence intervals are about confidence, not probability. We say we're '95% confident' that the interval contains the true mean, rather than there being a 95% chance.
Q & A
What is a sampling distribution, and how is it used in building confidence intervals?
-A sampling distribution represents all possible estimates that could result from repeated sampling of the population. It helps in building confidence intervals by showing that the sample mean tends to approximate the population mean, and under certain conditions, is normally distributed.
Why is the sample mean approximately normally distributed?
-When specific conditions, such as a sufficiently large sample size, are met, the Central Limit Theorem states that the distribution of sample means will be approximately normal, regardless of the population distribution. This allows us to use normal distribution properties to estimate probabilities.
What is the 'standard error of the mean,' and why is it important?
-The standard error of the mean is the standard deviation of the sampling distribution. It indicates how much the sample mean is expected to fluctuate from the true population mean, and is essential for calculating confidence intervals.
What is the 68-95-99.7 rule, and how does it relate to confidence intervals?
-The 68-95-99.7 rule states that for a normal distribution, approximately 68% of the data falls within one standard deviation of the mean, 95% within two, and 99.7% within three. For confidence intervals, the 95% rule is often used, meaning 95% of the sample means will be within two standard deviations of the population mean.
What does it mean when we say '95% of the time, the true mean is within the confidence interval'?
-It means that if we took repeated samples, 95% of the confidence intervals calculated from those samples would contain the true population mean. This gives us confidence in using the interval to estimate the population parameter.
Why don't we know for sure if our confidence interval contains the true population mean?
-In practice, we only get one sample and its associated confidence interval. While 95% of such intervals will contain the true mean, we don’t know if the interval from our specific sample is one of those 95% or not.
How do we adjust when the population standard deviation is unknown?
-When the population standard deviation is unknown, we replace it with the sample standard deviation. This leads to using a t-distribution instead of a normal distribution, which adjusts for the added uncertainty in estimating the population standard deviation.
What is the difference between a z-value and a t-value in confidence interval estimation?
-A z-value is used when the population standard deviation is known and assumes a normal distribution. A t-value is used when the population standard deviation is unknown, and the t-distribution adjusts for the smaller sample sizes by being slightly wider than the normal distribution.
Why do we say we are '95% confident' instead of saying there is a '95% probability' the true mean is in the interval?
-We use '95% confident' because the true population mean is either in the interval or it isn’t (a certainty, not a probability). The confidence refers to the long-run success rate of the method: 95% of intervals created from repeated samples will contain the true mean.
How does the concept of sampling variability affect our understanding of confidence intervals?
-Sampling variability means that different samples will produce different sample means and intervals. However, confidence intervals account for this variability, allowing us to estimate where the true mean lies in relation to our sample, with a certain level of confidence.
Outlines

This section is available to paid users only. Please upgrade to access this part.
Upgrade NowMindmap

This section is available to paid users only. Please upgrade to access this part.
Upgrade NowKeywords

This section is available to paid users only. Please upgrade to access this part.
Upgrade NowHighlights

This section is available to paid users only. Please upgrade to access this part.
Upgrade NowTranscripts

This section is available to paid users only. Please upgrade to access this part.
Upgrade NowBrowse More Related Video
Understanding Confidence Intervals: Statistics Help
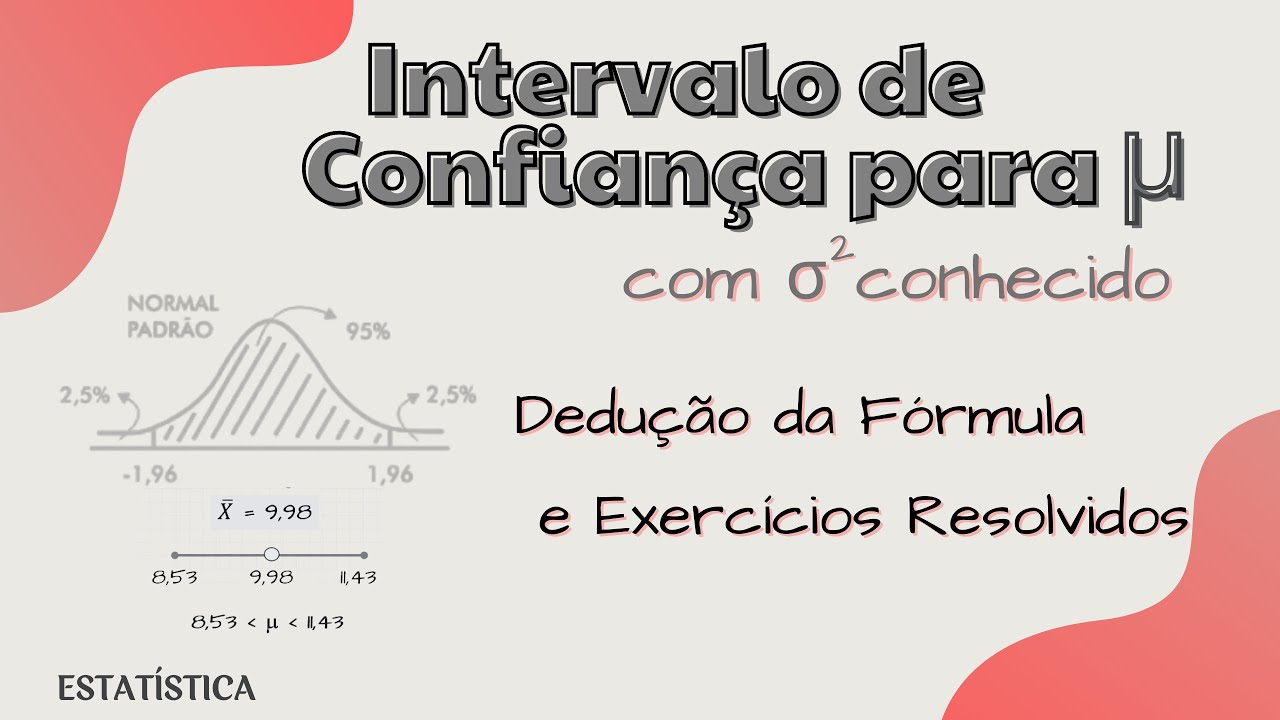
Intervalo de Confiança para a Média Populacional (μ) com variância populacional conhecida
Hypothesis Test vs. Confidence Interval | Statistics Tutorial #15 | MarinStatsLectures
Confidence Intervals, Clearly Explained!!!
Confidence Interval [Simply explained]
STATPRO - 10 Point and Interval Estimate of population Mean
5.0 / 5 (0 votes)