Hypothesis Testing Explained | Statistics Tutorial | MarinStatsLectures
Summary
TLDRThis video explains how sampling distributions are used to build hypothesis tests, focusing on one numeric variable. It uses an example of systolic blood pressure, describing how a sample mean can be compared to a population mean to test hypotheses. The video illustrates calculating probabilities and discusses the null and alternative hypotheses in the context of smokers' blood pressure. The concept of standardizing and calculating p-values is introduced, setting the foundation for more formal discussions on hypothesis testing in future videos.
Takeaways
- 📊 The video discusses how the sampling distribution is used to build a hypothesis test for a numeric variable.
- 📉 In the example, the systolic blood pressure in a population is skewed, with a mean of 125 and a standard deviation of 20.
- 📐 The sampling distribution of the mean is approximately normal if certain conditions are met, with a mean of 125 and a standard error of 4.
- 🤔 The probability of getting a sample mean greater or equal to 135 in a sample of 25 observations is about 0.6%, assuming the population mean is 125.
- 📏 The standardized z-score for a sample mean of 135 is calculated as 2.5 standard deviations above the population mean.
- 🔄 The video transitions to hypothesis testing by assuming a null hypothesis, where the mean systolic blood pressure of smokers is equal to that of a healthy population.
- 🧪 In hypothesis testing, the null hypothesis states that smokers' blood pressure is the same as the healthy population, while the alternative suggests it's greater.
- 🧮 To test the hypothesis, the t-distribution is used because the population standard deviation is unknown, and only an estimate is available.
- 💡 The concept of the p-value is introduced, representing the probability of observing a result as extreme as the sample, assuming the null hypothesis is true.
- 📋 The video sets the foundation for hypothesis testing, promising further explanation in subsequent videos.
Q & A
What is the sampling distribution, and how is it used in hypothesis testing?
-The sampling distribution is a theoretical set of all possible sample means from a population. It helps us understand the probability of obtaining certain results when we collect data. In hypothesis testing, it is used to compare a sample mean to a known population mean and determine the likelihood of observing a sample mean as extreme or more extreme, under the assumption that the null hypothesis is true.
What are the population parameters given in the example, and what do they represent?
-In the example, the population has a mean systolic blood pressure of 125 and a standard deviation of 20. These represent the average systolic blood pressure and the variability of blood pressure in the entire population.
What conditions allow the sampling distribution to be approximately normal?
-The sampling distribution of the mean becomes approximately normal if certain conditions are met, such as a sufficiently large sample size (typically n > 30) and the underlying population distribution not being highly skewed.
What is the 'standard error of the mean,' and how is it calculated?
-The standard error of the mean (SE) measures how much the sample mean is expected to vary from the population mean. It is calculated as the population standard deviation divided by the square root of the sample size (SE = σ / √n). In this case, SE is 20 / √25 = 4.
How do you calculate the probability of obtaining a sample mean of 135 or greater, given a population mean of 125?
-First, the difference between the sample mean (135) and the population mean (125) is calculated. This difference is divided by the standard error (4), resulting in a standardized value (z-score) of 2.5. Using the standard normal distribution, the probability of obtaining a sample mean of 135 or more is found to be 0.6% (6 in 1,000).
What is the purpose of standardizing a sample mean, and how is it done?
-Standardizing a sample mean allows us to express the sample mean in terms of standard deviations from the population mean. This is done by subtracting the population mean from the sample mean and dividing by the standard error. In this case, the sample mean of 135 is 2.5 standard deviations above the population mean of 125.
What is the null hypothesis (H₀) and the alternative hypothesis (H₁) in this example?
-The null hypothesis (H₀) is that the mean systolic blood pressure of smokers is the same as that of the healthy population, or 125. The alternative hypothesis (H₁) is that the mean systolic blood pressure of smokers is greater than 125.
How does the example transition from knowing population parameters to conducting a hypothesis test?
-Initially, the example assumes the population parameters are known (mean = 125, standard deviation = 20) and calculates the probability of observing certain sample means. To conduct a hypothesis test, it switches to assuming the population mean is 125 (null hypothesis) and evaluates whether the sample mean of 135 is significantly higher, given the sample data.
What role does the t-distribution play in hypothesis testing, and why is it used in this example?
-The t-distribution is used instead of the normal distribution when the population standard deviation is unknown and must be estimated from the sample. In this example, the t-distribution would be used because we are estimating the standard deviation based on the sample data, and it accounts for the added uncertainty in smaller samples.
What is the p-value, and how does it relate to hypothesis testing in this example?
-The p-value is the probability of obtaining a sample mean as extreme as or more extreme than the observed sample mean, assuming the null hypothesis is true. In this example, the p-value is approximately 0.6%, meaning that there is a 0.6% chance of observing a sample mean of 135 or higher if the population mean is truly 125. A low p-value suggests that the observed sample mean is unlikely under the null hypothesis.
Outlines

Cette section est réservée aux utilisateurs payants. Améliorez votre compte pour accéder à cette section.
Améliorer maintenantMindmap

Cette section est réservée aux utilisateurs payants. Améliorez votre compte pour accéder à cette section.
Améliorer maintenantKeywords

Cette section est réservée aux utilisateurs payants. Améliorez votre compte pour accéder à cette section.
Améliorer maintenantHighlights

Cette section est réservée aux utilisateurs payants. Améliorez votre compte pour accéder à cette section.
Améliorer maintenantTranscripts

Cette section est réservée aux utilisateurs payants. Améliorez votre compte pour accéder à cette section.
Améliorer maintenantVoir Plus de Vidéos Connexes

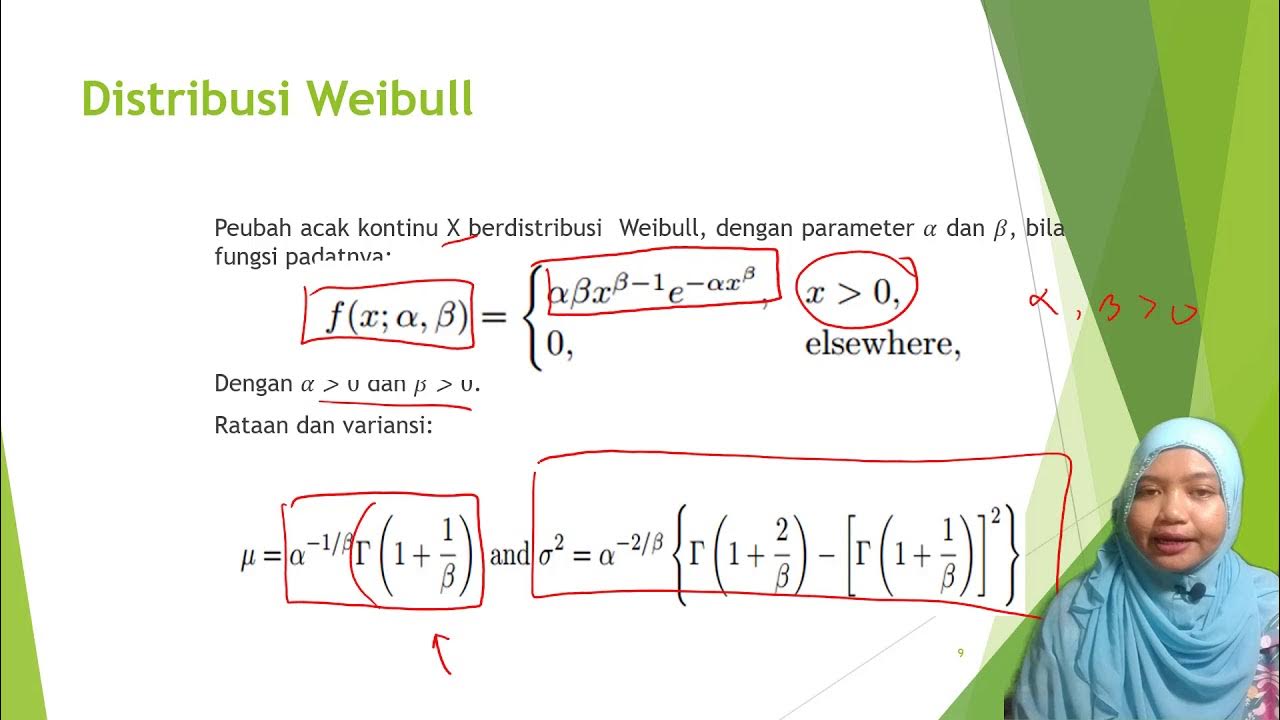
Distribusi Chi-square, Weibull, t dan F

PERBEDAAN UJI REGRESI LOGISTIK DAN UJI REGRESI LINEAR | PENJELASAN MUDAH DIPAHAMI MAHASISWA

Uji Hipotesis: Lemma Neyman - Pearson (Kuasa Uji)

[PART 2] KONSEP DASAR STATISTIKA INFERENSIA

pengujian hipotesis rata-rata dan proporsi suatu populasi

Pengujian Hipotesis Part 1
5.0 / 5 (0 votes)
