Introducing Jamovi

Ross Avilla
6 Aug 202006:44

Summary

TLDRThe video introduces data analysis in a class, emphasizing the use of the Jamovi software for statistical tasks. Unlike complex tools like SPSS or R, Jamovi simplifies data analysis without requiring programming skills. The instructor explains how to download, set up, and input data in Jamovi, including coding variables such as gender, social media, and age with numeric values. The video serves as a beginner's guide, walking through basic operations like opening data sets and entering information, while preparing students for more complex tasks in the following lessons.

Takeaways

  • 🖥️ The class will focus on data analysis using computer programs instead of manual calculations.
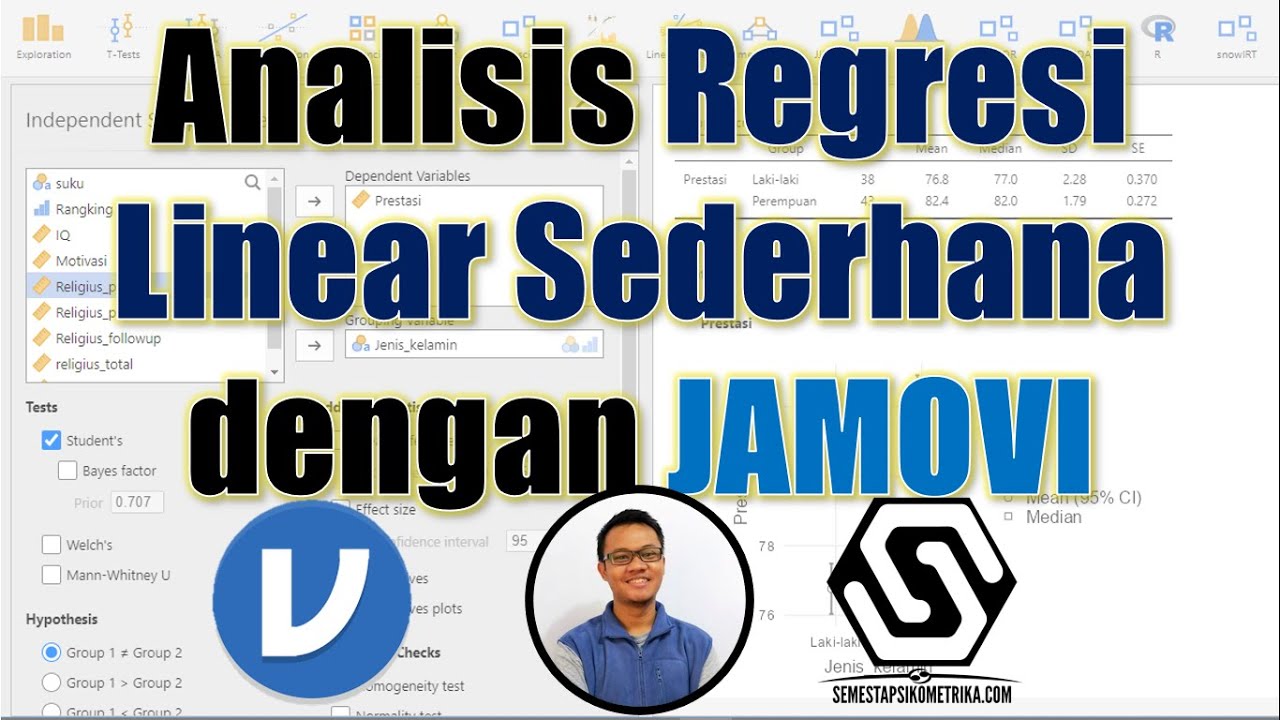
  • 📊 While many researchers use complex programs like SPSS and R, this course will use Jamovi for simplicity.
  • 🧑‍💻 Jamovi is built on R but doesn't require programming skills, making it easier to use for beginners.
  • 💾 To download Jamovi, go to jamovi.org and choose the version that suits your operating system.
  • 🔍 When Jamovi is opened, users see a blank dataset where they can input variables and data points.
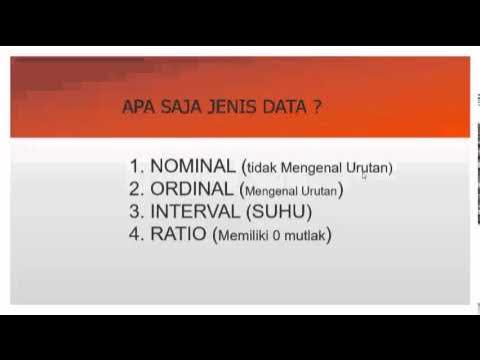
  • 📋 Data in Jamovi is always represented by numbers, even for categorical variables like gender or social media use.
  • 👨‍👩‍👧‍👦 Variables like gender are coded numerically, where values like '1' may represent 'male' and '2' represents 'female'.
  • 🔢 Jamovi allows users to explore variables by double-clicking, which shows how each is coded and labeled.
  • ✍️ New data entries must follow the established numerical codes for the software to recognize the input.
  • 📂 The lesson covers how to download, install, and use Jamovi, and how to enter data, with more complex tasks to come.

Q & A

  • What is the main focus of this class regarding data analysis?

    -The main focus of this class is to conduct data analysis using computer programs, similar to what researchers do. The class will focus on using a program called Jamovi rather than performing statistics by hand or formula.

  • Why does the instructor choose Jamovi for this class instead of other statistical software?

    -The instructor chooses Jamovi because it is simpler and easier to use compared to more complex programs like SPSS or R, which can have a steep learning curve. Jamovi is designed for teaching and learning, making it accessible without needing programming skills.

  • What is Jamovi built on, and how does it compare to R?

    -Jamovi is built on a larger and more robust statistical program called R. However, unlike R, Jamovi does not require any programming skills, making it more user-friendly for students.

  • How do you download and install Jamovi on your computer?

    -To download Jamovi, you need to go to jamovi.org, click on 'Download', and choose the appropriate version for your operating system. You can download either the solid or current version, though the instructor recommends the current one for its latest features.

  • How does Jamovi represent data when you open a dataset?

    -When you open a dataset in Jamovi, it displays the variables as columns on one side of the screen. On the other side, you can view the analyses. Each variable can be double-clicked to see more detailed information about its coding and labels.

  • How does Jamovi handle categorical data like gender or yes/no questions?

    -Jamovi requires all data to be represented as numbers. For example, gender might be coded as 1 for male and 2 for female. Yes/no questions are similarly coded (e.g., 1 for 'no' and 2 for 'yes'). The program automatically interprets and displays these labels based on the number entered.

  • What happens if you try to input non-numerical data in Jamovi?

    -If you try to input non-numerical data, such as 'male' or 'female' directly, Jamovi will not accept it. You must input the corresponding numerical code (e.g., 1 for male, 2 for female).

  • How does Jamovi handle numerical data such as age?

    -Numerical data, like age, can be entered directly as numbers. For example, if a participant is 20 years old, you can simply input '20' without any coding.

  • What should you do if you're unsure how a variable is coded in Jamovi?

    -If you're unsure how a variable is coded, you can double-click the column header for that variable. Jamovi will display the coding scheme, showing how each label is represented by a number.

  • What are the next steps for the class after learning how to install and use Jamovi?

    -The next steps are to install Jamovi, open the provided dataset, and practice entering data. The first homework will involve entering some data into the program. More complex analyses will be introduced in the following weeks once everyone is familiar with the software.

Outlines

00:00

📊 Introduction to Data Analysis and Software for the Course

In this class, the focus will be on data analysis, similar to what students may have done in previous psychology or statistics classes, but with a different approach. Instead of manually performing calculations or using formulas, students will use computer programs like researchers do. The software chosen for this class is Jamovi, which is simpler compared to more complex tools like SPSS and R, making it ideal for teaching and learning without requiring programming skills.

05:00

🖥️ Installing and Setting Up Jamovi

The instructor explains how to download and install Jamovi by visiting jamovi.org. On a Mac, the website detects the operating system and offers two download options, either of which can be used for the class. The current version is recommended as it includes the latest features. After installation, the user can open Jamovi and start with a blank dataset, consisting of variables in columns and areas for data analysis. The instructor demonstrates how to open a sample dataset to visualize the structure of the data.

🔢 Data Entry and Coding in Jamovi

Jamovi requires all data to be entered as numbers, even for categorical variables like gender. The instructor demonstrates how to code gender responses, where 'male' is coded as 1 and 'female' as 2. When entering new data, users must input the assigned numerical codes rather than typing out the labels (e.g., male or female). Jamovi automatically recognizes and assigns the corresponding label when a number is entered. This process is different from spreadsheet programs like Excel.

🧑‍🤝‍🧑 Exploring Variables in Jamovi

Jamovi allows users to explore more details about each variable by double-clicking on it. For instance, by examining the 'gender' variable, the instructor shows how the variable is coded and labeled. In this case, the variable reflects answers to the question 'What is your gender?' and is coded numerically (1 for male, 2 for female). The program enforces numerical data entry, even for non-numeric answers like 'yes' or 'no,' as in the social media usage variable.

📈 Handling Categorical and Numerical Variables

The instructor explains how to handle different types of variables in Jamovi, such as social media usage (a yes/no question) and age (a purely numeric variable). Each variable has corresponding codes for its responses. For instance, a 'yes' in the social media variable is coded as 2, and age is entered directly as a number. The instructor demonstrates how to input data for a new participant, ensuring that all categorical responses are entered as the appropriate numbers.

🔄 Entering New Data and Understanding Labels

When entering new data in Jamovi, the user must follow the numerical coding system assigned to each variable. For example, gender is coded as 1 for male and 2 for female, and race might be coded with numbers representing different categories. Jamovi enforces this by only accepting numbers during data entry. Users can always double-click on a variable's header to review the coding scheme if unsure.

📂 Opening Data Sets and Entering Data in Jamovi

The instructor wraps up the session by explaining how to open datasets in Jamovi, browse the computer for files, and enter data into the program. Since Jamovi enforces numerical data input, users must use the assigned number codes for each variable when entering new information. For homework, students are tasked with downloading and working with a dataset, entering new data while following the program's conventions.

Mindmap

Keywords

💡Data Analysis

Data analysis refers to the process of examining, cleaning, and transforming data to uncover useful information. In the video, the instructor explains that this class will focus on using data analysis tools, such as Jamovi, to interpret and understand research data, instead of doing manual calculations.

💡Jamovi

Jamovi is the statistical software chosen for the class, designed to make data analysis simpler and more accessible. It is built on top of the more complex R programming language, but unlike R, it doesn't require programming skills, making it more suitable for beginners.

💡Statistical Programs

Statistical programs are software tools used to analyze data and perform statistical tests. The video mentions complex programs like SPSS and R, which have steeper learning curves, and introduces Jamovi as a user-friendly alternative for students learning data analysis.

💡R Programming

R is a powerful statistical programming language used by researchers to perform advanced data analyses. While Jamovi is built on R, the video emphasizes that students won't need to write code, as Jamovi provides an intuitive interface for performing similar analyses without programming knowledge.

💡Variables

Variables are data points or characteristics that can take on different values, such as gender, age, or social media usage. In the video, the instructor explains how variables are represented as columns in Jamovi, and how each variable's data can be viewed and edited.

💡Coding Data

Coding data refers to assigning numerical values to qualitative or categorical data for easier analysis. For example, in Jamovi, 'male' is coded as 1 and 'female' as 2. This is necessary because Jamovi requires all data to be entered as numbers.

💡Labels

Labels are the descriptive names assigned to coded data. In the video, the instructor shows how Jamovi uses labels to represent numerical codes, such as showing 'male' when the number 1 is entered. This makes it easier to understand the meaning of coded data.

💡Data Set

A data set is a collection of related data, typically organized into rows and columns. In the video, the instructor opens a data set containing variables like gender and social media usage, explaining how to navigate and input new data within Jamovi.

💡Entering Data

Entering data involves adding new information to a data set. In Jamovi, data must be entered in numerical form, with each variable coded accordingly. The video demonstrates how students will input data, such as using 1 for male and 2 for female, to complete their assignments.

💡Numerical Representation

Numerical representation refers to the process of converting qualitative data into numbers for analysis. The instructor explains that Jamovi requires data, like gender or social media usage, to be entered as numbers rather than text, to facilitate statistical calculations.

Highlights

The class will focus on data analysis using computer programs rather than performing statistics by hand.

Researchers often use complex programs like SPSS and R, but this class will use a simpler tool, Jamovi.

Jamovi is built on R but is much easier to use, especially for those without computer programming skills.

Jamovi can perform the same data analyses as more complex programs used by researchers.

The instructor provides a step-by-step guide to download and install Jamovi from its official website, jamovi.org.

Jamovi displays a blank dataset where variables and columns are added, similar to other statistical programs.

Data in Jamovi needs to be entered as numbers, even for categorical variables like gender.

Variables in Jamovi can be examined by double-clicking on them to view labels and data coding.

Gender, for example, is coded numerically as 1 for male and 2 for female.

Social media usage is coded as 1 for 'No' and 2 for 'Yes' based on the question 'Do you have three or more active social media accounts?'

Entering data for a new participant involves using the assigned numeric codes for each variable.

Some variables, like age, are just numbers without coded labels, while others like race have specific codes.

Jamovi ensures that all data is entered in numeric form, making it distinct from spreadsheet programs like Excel.

The instructor emphasizes double-clicking on a variable header to view coding schemes when unsure how to enter data.

This week's task is to install Jamovi, open a dataset, and enter some basic data for homework.

Transcripts

play00:00

so one of the things we're going to be

play00:01

doing in this class quite a bit

play00:03

is data analysis now you maybe have done

play00:05

some statistical analyses before

play00:07

such as in an introductory psychology

play00:10

class or

play00:11

statistics class but in this class we're

play00:13

not going to be doing statistics by hand

play00:15

or by formula we're going to do it like

play00:17

researchers do it which is to use

play00:18

computer programs

play00:20

now a lot of researchers use programs

play00:23

that are quite complex

play00:24

such as spss and r and

play00:27

these programs can have quite a bit of a

play00:29

learning curve to them

play00:30

so instead we're going to use a program

play00:32

that's more meant for

play00:34

teaching and learning in a more

play00:35

simplistic way but we're going to be

play00:36

able to do all the same stuff that

play00:38

researchers often do with data

play00:40

now the program i've chosen for this

play00:41

class is called jamovi

play00:43

it's built on a more large and robust

play00:46

uh sort of statistical program called r

play00:50

like the so called r integration but

play00:52

it's a lot easier to use it doesn't

play00:54

require any computer programming skills

play00:56

like r

play00:56

does so to get jmovie on your computer

play01:00

you just go to jmovie.org

play01:02

click on download and then since i'm on

play01:05

a mac it's automatically detected that

play01:07

and it's given me two options

play01:08

the solid and the current form you can

play01:11

download

play01:12

either these are really the same for our

play01:13

purposes

play01:15

i just downloaded the the most current

play01:17

one that has the latest features for my

play01:18

own self

play01:20

so once you have that downloaded and you

play01:22

install it on your machine

play01:24

you can open it up let me start with a

play01:27

sort of a

play01:28

new data set here

play01:31

and basically when you open up jmovie

play01:34

you're going to have just sort of a

play01:35

blank data set where you have some

play01:36

variables some columns

play01:38

and then this side of the screen is

play01:39

usually when you have some analyses

play01:42

so jumobi is a relatively simple program

play01:45

to set up

play01:46

basically you have some data and let me

play01:48

go and just open it up

play01:49

just any data to kind of show you what

play01:51

that looks like

play01:52

but if i go up here to open and i'll go

play01:56

to my pc i have some data from a

play01:58

previous one so i'll just open this up

play02:01

that basically on this side of the

play02:03

screen it's going to represent the data

play02:04

that you have

play02:06

so in this case we have some variables

play02:07

this one's called gender

play02:09

this one's called social media this

play02:12

one's called

play02:13

video games and we're gonna we won't

play02:15

really get into what this data even is

play02:16

it doesn't matter but this is how data

play02:18

often looks

play02:20

now one things about jemovi is you can

play02:23

look deeper in each variable by double

play02:25

clicking on it so if we want to know

play02:27

what gender actually is

play02:28

which it seems obvious but let's go and

play02:30

see how it's coded and things like that

play02:32

we'll double click on it and basically

play02:35

it gives us all the

play02:36

variable information so here we have a

play02:38

data variable called gender

play02:40

and also i've added a label which i

play02:42

usually do which represents

play02:43

what were participants actually asked to

play02:45

answer in this case just what is your

play02:47

gender

play02:48

now for this uh basically in jumovi

play02:51

whenever you have data it always has to

play02:53

be represented with numbers

play02:55

even if the data is something like male

play02:57

or female or a yes or no

play03:00

but the way to do this is we code the

play03:02

data so in this case

play03:04

a male answer was coded as

play03:07

a one and a female answer was coded

play03:10

as a two now what that means is let's

play03:13

say if i wanted to

play03:14

input another data point here we

play03:16

scrolled the bottom of this data set

play03:20

it's quite a long data set there we go

play03:23

if i want to enter in a new

play03:24

participant's data i wouldn't type in

play03:26

mail because it actually doesn't even

play03:29

accept that if i hit enter it doesn't

play03:30

really do anything if i click off of it

play03:32

i can't

play03:33

because you always have to enter data as

play03:35

a number but since i've assigned

play03:37

the number 1 to male if i erase that and

play03:40

i put in a 1

play03:41

and i hit enter then it recognizes that

play03:44

and then it automatically fills it in

play03:47

with whatever i've labeled that number

play03:48

with so it's just one of those things

play03:50

about your movie that is a little

play03:52

different from other

play03:53

spreadsheet programs you're maybe more

play03:55

familiar with like microsoft excel

play03:57

is that you always have to input numbers

play04:00

the same thing here if i look at social

play04:02

media as soon as i click on it it gives

play04:04

me the view of that we have the number

play04:06

or the variable social media

play04:08

and this is the actual question that

play04:09

participants were

play04:11

asked do you have three or more active

play04:13

social media accounts

play04:14

which is just a yes or no question but

play04:16

here once again we have

play04:18

labels for this so a no is represented

play04:20

by a one

play04:21

and a yes is represented by a two so

play04:24

let's say if this male participant had

play04:26

three or more

play04:27

active social media accounts we could

play04:28

just put a two in here

play04:30

and then it'll automatically fill it in

play04:31

as a yes and so on and so forth

play04:35

now sometimes you have variables that

play04:36

don't have any labels attached to them

play04:38

in fact let me try to find one that

play04:39

looks more like that let me go up a

play04:42

little bit

play04:45

let's take a look at this one here we go

play04:48

so in this data set basically we have

play04:50

one variable of

play04:50

age if we click on this basically this

play04:54

is just

play04:54

numbers and it represents that as levels

play04:58

that don't have any kind of number

play05:00

attached to them so let's say if we had

play05:01

a new participant

play05:03

who had the age of 20 here we could just

play05:05

put in a 20. and since it's a number

play05:07

it accepts that but once again if we

play05:10

want to know whether that participant is

play05:11

male or female let's say they're female

play05:13

in this case we again can't put in

play05:15

female won't accept that

play05:17

but we can put in a 1 and it knows what

play05:20

that is

play05:21

and then for this variable let's say

play05:23

what the race is let's say it's

play05:24

multiracial

play05:26

for that we're going to put in a 5 and

play05:28

that's how you'd enter in that data

play05:31

so that's though maybe one tricky thing

play05:33

about entering in data in jumovie is you

play05:35

always have to enter it as a number but

play05:37

as long as you can see the variable's

play05:39

information you can see

play05:41

what all these labels are assigned to

play05:43

how they were coded into different

play05:45

numbers in this case so that's really

play05:47

all we're going to cover this week

play05:49

is just how to your movie how to get it

play05:52

from jmovie.org how to open it up

play05:54

and how to open up a data set which

play05:57

basically you just go

play05:59

up here click open and then you can just

play06:01

browse your computer wherever you want

play06:03

to

play06:03

find your data and once you have that up

play06:07

how to maybe enter in some data which

play06:09

again you always have to do with numbers

play06:12

if you ever get stuck you're like i want

play06:13

to enter in latinx here

play06:15

but i don't know how to do that always

play06:16

remember you can double click on the

play06:18

header

play06:20

it'll give you all the number schemes so

play06:22

latinx in this case was

play06:23

coded as a one okay so

play06:26

it's just enough to kind of get your

play06:28

feet wet check out the program you can

play06:30

open up the data set that's offered this

play06:32

week which looks like this

play06:34

and basically you're just going to enter

play06:36

in a little bit of data for your

play06:36

homework this week and then we'll jump

play06:38

into some more complex stuff

play06:39

next week once everybody has it

play06:41

installed is ready to go

Rate This

5.0 / 5 (0 votes)

Étiquettes Connexes
Data AnalysisJamoviStatisticsResearch ToolsEasy SoftwareData EntryBeginner FriendlySPSS AlternativeR IntegrationSimplified Learning
Besoin d'un résumé en anglais ?