Sample and Population in Statistics | Statistics Tutorial | MarinStatsLectures

MarinStatsLectures-R Programming & Statistics
21 Jun 201809:10

Summary

TLDRThis video script delves into the concepts of samples and populations in statistics. It uses examples of disease prevalence and height to illustrate how sample proportions and means can be used to estimate population parameters. The script explains the use of bar plots and histograms to visualize data distribution and introduces the binomial and normal distributions to model theoretical probability distributions of populations. The goal is to understand how to make statistical inferences about populations based on sample data.

Takeaways

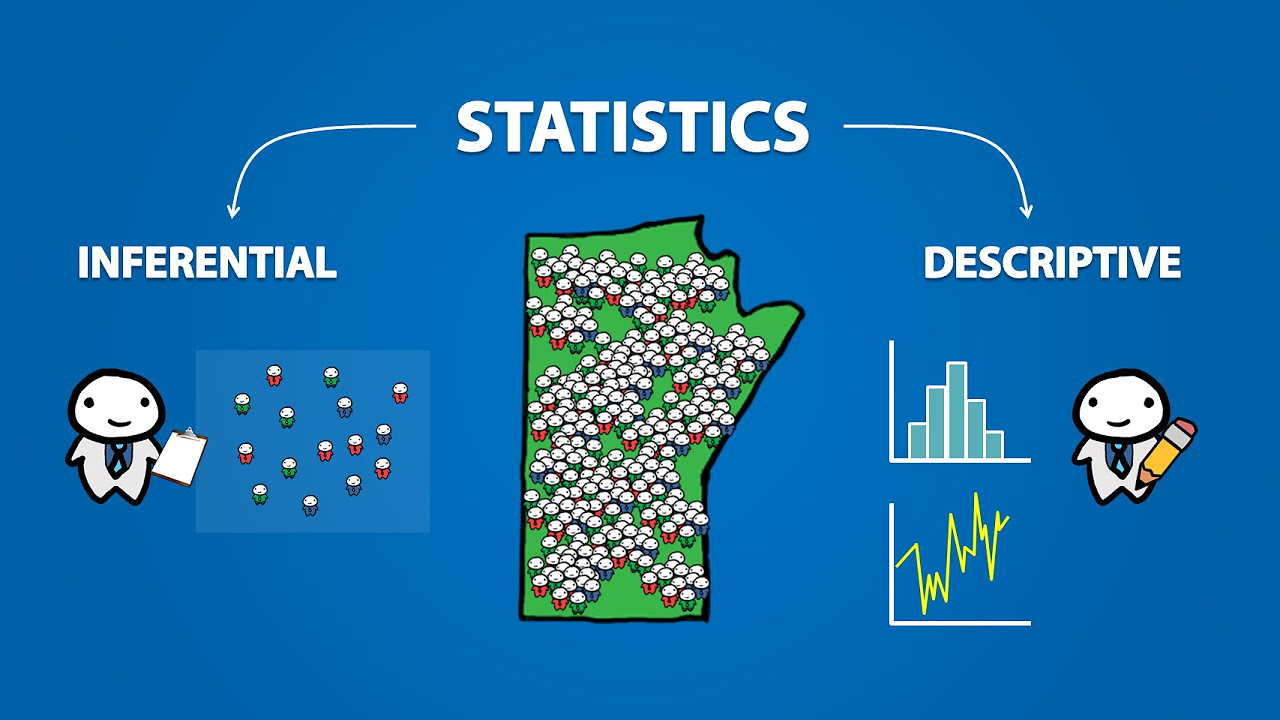
  • 🔍 The video discusses the concepts of samples and populations in statistics.
  • 📊 A sample is a subset of a population used to estimate characteristics of the whole population.
  • 📈 The categorical variable 'X' in the sample is used to record the presence of a disease, summarized by a sample proportion (P-hat).
  • 📉 A bar plot is used to visualize the distribution of the sample data, showing the probability of having the disease.
  • 🧬 The true probability of having the disease in the entire population can be modeled using a theoretical probability distribution.
  • 📚 The binomial distribution is introduced as a model for the population, with parameters n (number of trials) and p (probability of success).
  • 📊 For numeric variables like height, the sample mean and standard deviation are calculated to summarize the data.
  • 📊 A histogram or box plot is used to graphically summarize the distribution of the numeric variable in the sample.
  • 📊 The population's distribution of height is assumed to be normally distributed with a mean of 175 cm and a standard deviation of 10 cm.
  • 🔼 The normal distribution is used to describe the theoretical distribution of the entire population's height.
  • 🔍 Understanding the population's true distribution helps in making statistical inferences from sample data.

Q & A

  • What is the main focus of the video?

    -The video focuses on explaining the concepts of samples and populations in statistics, and how they are connected.

  • What is a sample in the context of the video?

    -A sample refers to a subset of individuals taken from a larger population for the purpose of analysis, such as recording whether they have a particular disease.

  • How is the presence of disease in the sample quantified?

    -The presence of disease in the sample is quantified using a sample proportion, which is calculated as the number of individuals with the disease divided by the total number in the sample.

  • What is the sample proportion if 12 out of 100 individuals have a disease?

    -The sample proportion is 0.12 or 12%, indicating that 12% of the sample has the disease.

  • How is the distribution of a sample represented in the video?

    -The distribution of a sample is represented using a bar plot, showing the probability of individuals having or not having the disease.

  • What is a population in the context of statistics?

    -A population in statistics refers to the entire group of individuals or items that are the subject of the study.

  • How is the true probability of having a disease in the entire population modeled?

    -The true probability of having a disease in the entire population is modeled using a theoretical probability distribution, such as a binomial distribution with parameters n (number of trials) and p (probability of success).

  • What is the difference between a sample mean and a population mean?

    -The sample mean is the average of a subset of data from the population, while the population mean is the average of the entire population.

  • What is the role of the normal distribution in describing population data?

    -The normal distribution is used to describe the population data when the data is approximately bell-shaped and symmetrically distributed around the mean.

  • Why is it important to understand the distribution of a sample?

    -Understanding the distribution of a sample is important for making inferences about the population from which the sample was drawn.

  • What is the purpose of statistical inference?

    -The purpose of statistical inference is to make statements about a population based on the data collected from a sample.

Outlines

00:00

📊 Understanding Samples and Populations

This paragraph introduces the concepts of samples and populations in statistics. It uses the example of a sample taken from a population of 100 individuals to determine the presence of a disease. The variable X is categorical, recorded as 'yes' or 'no' for disease presence. In the sample, 12 individuals have the disease, leading to a sample proportion (p-hat) of 0.12 or 12%. This is visualized using a bar plot, which shows the probability of disease presence in the sample. The paragraph also discusses the idea of knowing the entire population's characteristics, such as the true probability of disease presence, which could be modeled using a binomial distribution with parameters n (number of trials) and p (probability of success). The true probability in the population is given as 10%, and the paragraph suggests that understanding this can help predict what might be observed in a sample.

05:01

📈 Analyzing Numeric Data with Means and Distributions

The second paragraph focuses on numeric variables, using height as an example. It discusses how to summarize data with a sample mean and standard deviation, and how these can be visually represented with a histogram or box plot. The histogram shows the distribution of heights in the sample, with the mean and standard deviation indicated. The paragraph then explores the hypothetical scenario of knowing the entire population's true mean and standard deviation, suggesting that height follows a normal distribution with a mean of 175 centimeters and a standard deviation of 10 centimeters. This theoretical normal distribution is described as bell-shaped and symmetric, which is a concept that will be formally introduced later. The understanding of the population's true characteristics is emphasized as crucial for statistical inference, allowing one to make statements about the population based on sample data.

Mindmap

Keywords

💡Sample

A sample refers to a subset of individuals or observations taken from a larger population. In the video, a sample of 100 individuals is used to study a variable (whether they have a disease or not). This sample helps infer information about the entire population without needing to survey everyone.

💡Population

The population refers to the entire group of individuals or observations that we are interested in studying. In the video, the population consists of individuals in a larger group from which samples are drawn, such as people who may or may not have a particular disease. Understanding the population helps to frame the conclusions we draw from sample data.

💡Proportion

Proportion refers to a part or fraction of the total that exhibits a certain characteristic. In the video, the sample proportion (denoted as P-hat) is 0.12, representing 12% of the individuals in the sample who have the disease. This proportion helps summarize the data from the sample.

💡Categorical variable

A categorical variable is one that takes on categories or labels rather than numerical values. In the video, whether an individual has a disease (yes/no) is a categorical variable, and the video describes how this type of data is summarized using proportions.

💡Binomial distribution

The binomial distribution models the probability of a certain number of successes in a fixed number of trials, with a constant probability of success. The video discusses the binomial distribution in relation to whether an individual has a disease (success or failure), with the true population probability set at 10%.

💡Normal distribution

The normal distribution is a symmetric, bell-shaped probability distribution that is often used to model continuous variables, such as height. In the video, the population's height is assumed to follow a normal distribution with a mean of 175 cm and a standard deviation of 10 cm, helping illustrate how population-level data can be modeled.

💡Mean

The mean is the average value of a set of numbers. In the video, the sample mean refers to the average height of individuals in the sample. When discussing the population, the true mean is given as 175 cm, showing how a sample mean might relate to the population mean.

💡Standard deviation

Standard deviation measures the spread or variability of data from the mean. In the video, the true standard deviation for the population height is 10 cm. This value helps describe the dispersion of individuals’ heights around the mean in a normal distribution.

💡Theoretical probability distribution

A theoretical probability distribution describes the expected probabilities of different outcomes in a population. The video contrasts this with a sample distribution and explains how knowing the population distribution (such as the binomial or normal distribution) helps predict the likelihood of certain sample outcomes.

💡Statistical inference

Statistical inference is the process of drawing conclusions about a population based on data from a sample. The video outlines how knowing population parameters, such as the true mean or probability of disease, helps estimate the likelihood of observing certain results in a sample, leading to better inferences.

Highlights

Introduction to the concepts of samples and populations in statistics.

Explaining the process of taking a sample from a population and calculating a categorical variable.

Using a sample proportion to summarize categorical data.

Visual representation of sample data through bar plots.

Importance of understanding the distribution of sample data.

Concept of a theoretical probability distribution for the entire population.

Binomial distribution as a model for the probability of success in a population.

Describing the population's distribution using a theoretical probability distribution.

Module 2 focus on learning about the binomial distribution.

Example of calculating sample mean and standard deviation for a numeric variable.

Graphical summary of sample data using histograms or box plots.

Transitioning from sample data to understanding the entire population's true parameters.

Assumption of normally distributed height in the population with a known mean and standard deviation.

Introduction to the normal probability distribution and its characteristics.

Understanding how the normal distribution describes the population's distribution.

Theoretical visualization of the normal distribution as a series of bars.

Real-world approximations of the normal distribution and its implications.

Building understanding for statistical inference from sample data to population parameters.

Anticipating the next topic of discussion: statistical inference.

Transcripts

play00:00

So in this video we're going to talk a little bit about samples and populations

play00:03

and we're going to try and connect the two ideas. In intro statistics we are often

play00:08

alternating back and forth between the idea of a population and a sample so

play00:20

first let's talk a little bit about a sample, we can think of the example of

play00:27

say taking a sample from a population of size 100 and we're going to

play00:33

calculate some variable X, recording if they have a particular disease or not

play00:39

and record it as yes or no; and suppose in our sample we find that

play00:45

12 do have the disease. Here our X variable is categorical and so we're

play00:55

going to summarize this using a sample proportion which will label P-hat okay

play01:00

here we can think out of our 100 individuals 12 had the disease in the

play01:06

sample, so our sample proportion is 0.12 or 12% we can summarize this using a

play01:16

bar plot and we can think of here's our variable X if they have the disease or

play01:21

not we've have individuals who do and who don't and on here we are going to look at the

play01:27

probability of having the disease, so we can see in our sample 0.12 people did

play01:42

and 0.88 did not (have the disease) and this plot here describes for us the distribution of our

play01:52

sample and again the idea of a distribution is a very important concept in statistics

play02:00

In module 1 we learned all about summarizing a sample of data

play02:04

different ways to collect data make summary plots and summary statistics now

play02:09

let's think about what if we could know everything about the entire population

play02:14

so suppose we knew the true probability of having the disease within a

play02:19

population here we can think of modeling this or using a probability distribution

play02:24

to describe this so this is the idea of a theoretical probability distribution

play02:28

and these are described in module 2 of the course so continuing on in this

play02:33

example suppose we knew at the population level, suppose we know that

play02:42

the true probability of having the disease is 10% and some other conditions

play02:49

are met. Here we might think of X being whether or not someone has the disease

play02:54

as following a binomial distribution with parameters n trials P being the

play03:02

probability of success here 10%; and again we can think of describing this

play03:09

using a theoretical probability distribution so it's the exact same

play03:14

concept as this bar chart over here except rather than being for a sample of

play03:20

data this is for the entire population. and we're going to assume here we know

play03:24

the truth about it so again we can think of someone has a disease yes or no and

play03:31

in the population we're going to suppose we know 10% of the population has the

play03:37

disease 90% do not; so again this here is the binomial probability distribution

play03:55

or we can think of it as describing the population's distribution. So what we'll

play04:05

do in module two is we'll learn a bit about the binomial distribution

play04:09

supposing that we knew the truth of the population and this can help us

play04:13

understand when we collect some data how likely are certain things to show up in

play04:18

a sample, if we know that 10% of the population has a particular disease and

play04:23

we randomly select 100 people from that population what's the chance of

play04:27

observing 12 percent of people in our sample having the disease. Now let's take

play04:34

a look at another example: so let's think of an example now of taking another

play04:39

sample out of a population and let's suppose we randomly select 100

play04:45

individuals from this population and we record their height and again in

play04:52

centimeters here our X variable height is a numeric variable and so to

play05:01

summarize this we're going to calculate the sample mean as well as the sample

play05:10

standard deviation and again where we have this data to summarize it

play05:18

graphically we can think of making a histogram or a box plot so let's take a

play05:24

look at using a histogram here along the x axis we've got X or height when you

play05:31

think of heights going from 141, 170 ,200; on this axis here again this describes the

play05:40

probability and we might see something like this showing up, okay and again this

play05:58

here we can think of as describing the distribution of our sample

play06:09

for our 100 individuals what was the mean, what was the standard deviation

play06:13

and what's the distribution of their heights now we'd like to move into a

play06:17

world where we could suppose what if we knew the truth for the entire

play06:22

population so what if we knew the true mean the true standard deviation and the

play06:27

true shape of the distribution okay so let's think here of that now at the

play06:34

population level suppose we know that the true mean height is 175 centimeters

play06:43

we know that's a true standard deviation is 10 centimetres and we know that

play06:50

X being the height is approximately normally distributed and the normal

play06:56

distribution is something we'll formally introduce soon; so here we're thinking

play07:00

that at the population level height might be bell-shaped and symmetrically

play07:09

distributed around that mean of 175 are the true mean, okay again we can think of

play07:17

this here well this is the normal probability distribution and we can

play07:28

think of it as describing the populations distribution so again here

play07:35

living in this theoretical world where we suppose what if we knew the

play07:38

true mean and true standard deviation what if we knew the true histogram and

play07:42

the entire population was bell-shaped and symmetric. So it might help for

play07:48

the time being for you to visualize a series of bars if it helps you connect

play07:53

the idea of a probability distribution in this case of the normal distribution

play07:59

to a sample of data and now in a real world there's nothing that is perfectly

play08:06

normally distributed or bell-shaped and symmetric. A lot of things are

play08:09

approximately bell-shaped and symmetric okay and again we can use the

play08:14

understanding that we're going to build up here say if we knew the truth for the

play08:18

entire population how likely are certain things to show up

play08:21

when we collect a sample of data if we know that the true mean is 175

play08:27

centimeters what types of sample means are likely to show up when we collect

play08:32

some data okay again building up this understanding of if we know the truth

play08:37

how likely are certain things to show up in some data is going to help us

play08:41

to do statistical inference given our sample of data what statements can we

play08:45

make about a population so that's going to be our next topic for discussion

Rate This
★
★
★
★
★

5.0 / 5 (0 votes)

Étiquettes Connexes
StatisticsSamplesPopulationDiseaseBinomialDistributionNormalData AnalysisInferenceMeanStandard Deviation
Besoin d'un résumé en anglais ?