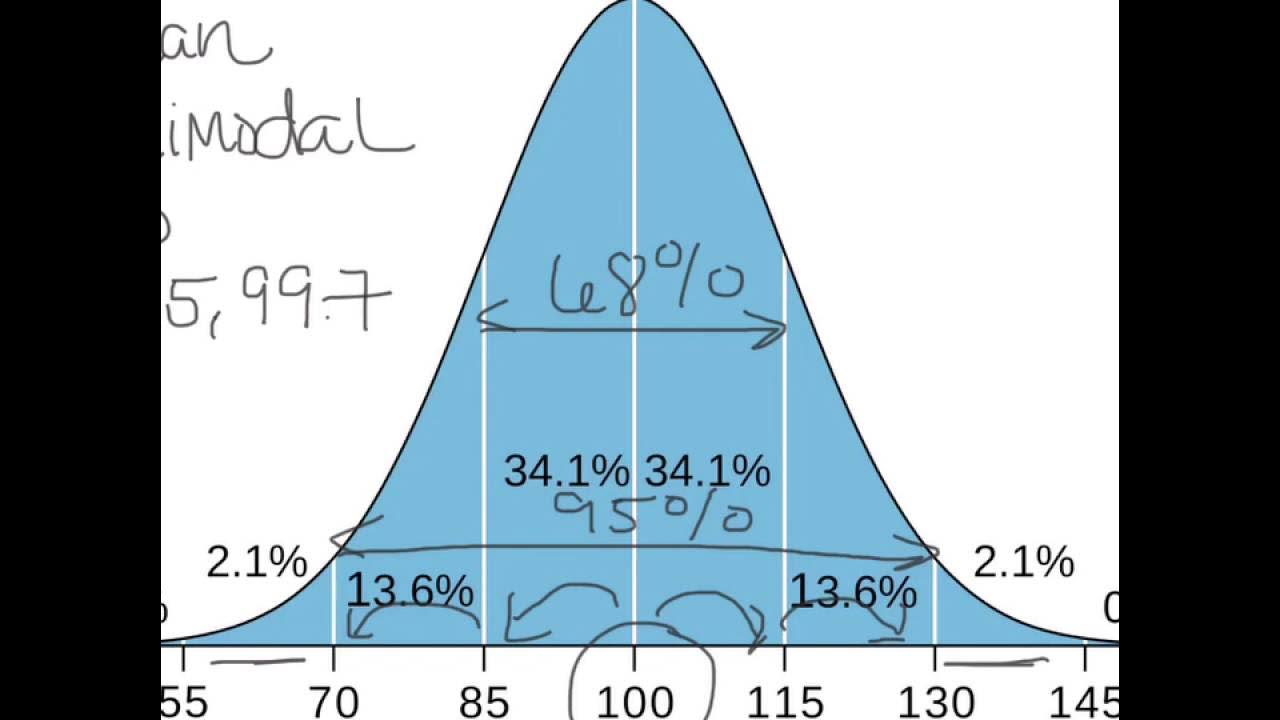
Normal Curve - Bell Curve - Standard Deviation - What Does It All Mean? Statistics Help
Summary
TLDRThis video delves into the normal curve, also known as the bell curve. It's a ubiquitous statistical distribution found in nature and society, such as IQ scores. The curve is symmetrical, peaking in the middle, with most values clustering around the average and fewer as you move towards the extremes. It illustrates how data is typically distributed, with the majority falling within one standard deviation of the mean, highlighting the concept's significance in various fields.
Takeaways
- 📊 The normal curve, also known as the bell curve, is a fundamental concept in statistics, representing the distribution of data.
- 🔍 The x-axis of the normal curve ranges from negative to positive values, with zero as the mean, and the y-axis represents the frequency or percentage of data points.
- 🌟 The normal curve's shape is consistent across various types of data distributions, regardless of the units or actual values measured.
- 🧠 An example of a normal distribution is the distribution of IQ scores, where most people score around the average, with fewer scoring very high or very low.
- 📈 The curve is symmetrical, with the majority of data points (approximately 68.2%) falling within one standard deviation from the mean.
- 📉 About 13.6% of the data points fall between one and two standard deviations from the mean, on either side of the curve.
- 📋 The curve extends to the far ends with very few data points, representing extreme values that are rare in occurrence.
- 🌐 The normal curve applies to a wide range of phenomena, including species distribution in habitats and many other natural and social science contexts.
- 📉 At the far ends of the curve, the percentage of data points is minimal, approaching 0.1% or even less.
- 📝 The video emphasizes the importance of recognizing the shape of the normal curve for understanding data distribution and identifying outliers or typical values.
Q & A
What is the normal curve?
-The normal curve, also known as the bell curve, is a type of distribution that is symmetric about its mean and shows that the majority of values cluster around the mean, with values tapering off as they get further away from the mean.
Why is the normal curve significant in statistics?
-The normal curve is significant because it represents the shape of many natural and social phenomena distributions, regardless of the actual units or amounts involved.
What does the X-axis represent in the normal curve graph?
-In the normal curve graph, the X-axis represents the range of values being measured, which could vary depending on what is being analyzed, from negative to positive values.
What is the significance of the Y-axis in the context of the normal curve?
-The Y-axis in the normal curve graph represents the frequency or probability of the values on the X-axis, showing how often each value occurs.
How is the shape of the normal curve described?
-The shape of the normal curve is described as symmetric, bell-shaped, and it is characterized by a peak in the middle with tails extending to the left and right.
What is the meaning of the term 'standard deviation' in the context of the normal curve?
-In the context of the normal curve, standard deviation is a measure of the amount of variation or dispersion in a set of values. It indicates how spread out the values are around the mean.
What percentage of the data falls within one standard deviation from the mean in a normal distribution?
-Approximately 68.2% of the data falls within one standard deviation from the mean in a normal distribution.
Can you provide an example of where the normal curve is applicable?
-An example of where the normal curve is applicable is in the distribution of IQ scores, where most people have an IQ near the mean, with fewer individuals having very high or very low scores.
What does the term 'long tail' refer to in the context of the normal curve?
-The term 'long tail' in the context of the normal curve refers to the area of the curve that extends far from the mean, representing the less common or extreme values.
How does the normal curve relate to the concept of 'normal' in everyday language?
-In everyday language, 'normal' often means typical or average. In the context of the normal curve, it refers to the values that are most common and occur with the highest frequency, which are closest to the mean.
What does the video suggest about the distribution of exceptional values in a normal curve?
-The video suggests that exceptional values, such as extremely high or low scores, are rare and are found in the tails of the normal curve, representing a very small percentage of the total distribution.
Outlines

Cette section est réservée aux utilisateurs payants. Améliorez votre compte pour accéder à cette section.
Améliorer maintenantMindmap

Cette section est réservée aux utilisateurs payants. Améliorez votre compte pour accéder à cette section.
Améliorer maintenantKeywords

Cette section est réservée aux utilisateurs payants. Améliorez votre compte pour accéder à cette section.
Améliorer maintenantHighlights

Cette section est réservée aux utilisateurs payants. Améliorez votre compte pour accéder à cette section.
Améliorer maintenantTranscripts

Cette section est réservée aux utilisateurs payants. Améliorez votre compte pour accéder à cette section.
Améliorer maintenantVoir Plus de Vidéos Connexes

Metode Statistika | Sebaran Peluang Kontinu | Mengenal Sebaran Normal

Distribusi Normal | Konsep Dasar dan Sifat Kurva Normal | Matematika Peminatan Kelas 12

Distribusi Normal Bagian 1 Matematika Minat Kelas XII Semester 2

What is a Bell Curve or Normal Curve Explained?

Z-Scores, Standardization, and the Standard Normal Distribution (5.3)

Peluang Distribusi NORMAL beserta Contoh Soal Pembahasan
5.0 / 5 (0 votes)
