How to Calculate a Correlation in Microsoft Excel - Pearson's r

Quantitative Specialists
15 Sept 201402:13

Summary

TLDRThis tutorial demonstrates how to calculate the correlation coefficient in Microsoft Excel to determine the relationship between two variables: hours studied and exam grades. The process involves selecting 'Data Analysis', choosing 'Correlation', and inputting the data range, including variable names. The result shows a strong positive correlation (r=.86), indicating that more study hours lead to better exam performance. The video concludes by hinting at the next step, which is to test the significance of this correlation.

Takeaways

  • 📊 The video demonstrates how to calculate the correlation coefficient in Microsoft Excel.
  • 📈 The example uses two variables: 'hours studied' and 'exam grade' to determine their relationship.
  • 🔍 The Data Analysis tool in Excel is utilized for calculating the correlation.
  • 📋 The 'Correlation' option is selected from the Data Analysis tool to proceed.
  • 👉 The 'Input Range' should include all relevant data cells, including variable names or labels.
  • ✅ The 'Labels in First Row' checkbox is important to select if the first row contains variable names.
  • 🔧 The correlation output is displayed, and the video shows how to adjust the display for better readability.
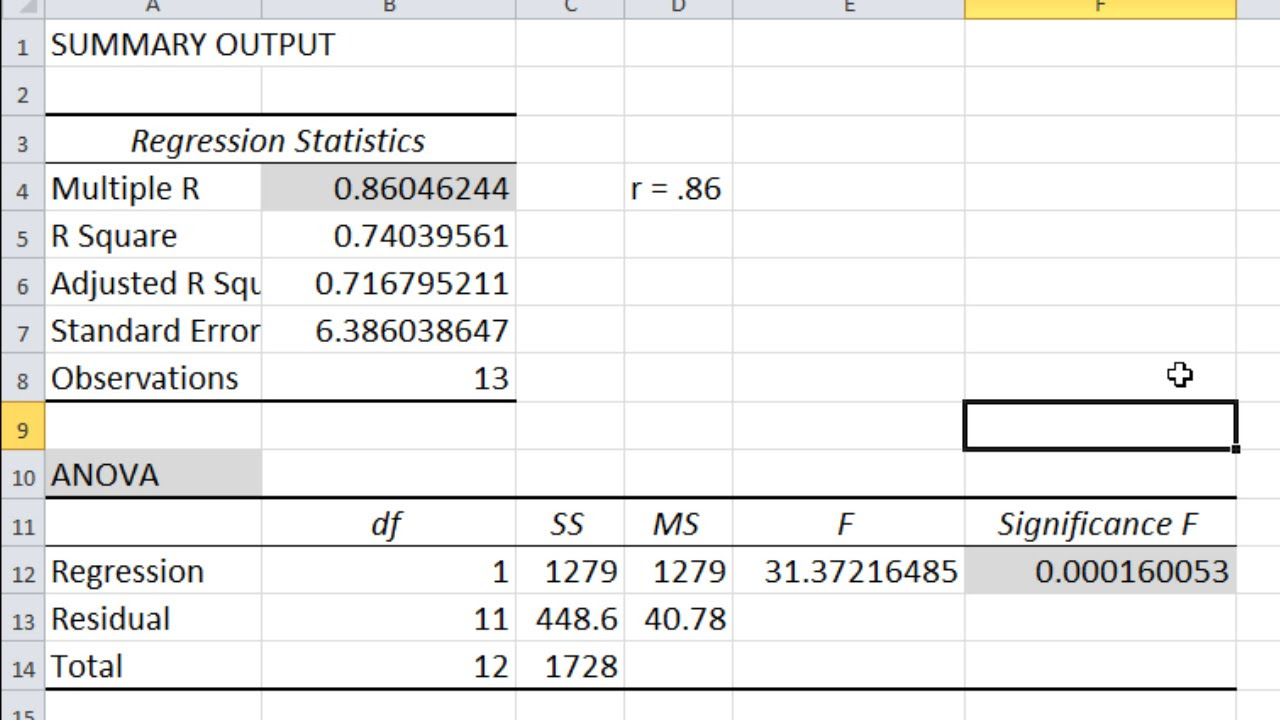
  • 📐 The correlation coefficient (r) is calculated as .86, indicating a strong positive relationship.
  • 📝 The interpretation of the correlation is that studying more hours is associated with higher exam grades.
  • 🔬 The video concludes by mentioning a future video will test the significance of the correlation coefficient.

Q & A

  • What is the main topic of the video?

    -The main topic of the video is how to calculate the correlation coefficient in Microsoft Excel.

  • What are the two variables used in the example?

    -The two variables used in the example are 'hours studied' and 'exam grade'.

  • What is the purpose of calculating the correlation between these two variables?

    -The purpose is to determine if there is a relationship between the number of hours studied and the exam grade.

  • How does one access the Data Analysis tool in Excel?

    -In Excel, one accesses the Data Analysis tool by going to the Data tab and selecting Data Analysis.

  • What option is chosen in the Data Analysis tool to calculate correlation?

    -In the Data Analysis tool, the 'Correlation' option is chosen to calculate the correlation.

  • Why is it important to select the 'Labels in First Row' option when calculating correlation?

    -It is important to select the 'Labels in First Row' option to include the variable names in the correlation calculation, ensuring that the results are correctly interpreted.

  • What is the correlation coefficient obtained in the example?

    -The correlation coefficient obtained in the example is .86.

  • What does a correlation coefficient of .86 indicate?

    -A correlation coefficient of .86 indicates a very strong positive correlation between the number of hours studied and the exam grade.

  • How is the positive correlation between hours studied and exam grade interpreted?

    -The positive correlation is interpreted as people who studied more hours tending to do better on the exam, and those who studied fewer hours tending to do worse.

  • What will be the focus of the next video in the series?

    -The next video will focus on testing the significance of the correlation coefficient .86 to see if it is significantly different from zero.

Outlines

00:00

📊 Calculating Correlation Coefficient in Excel

This paragraph explains the process of calculating the correlation coefficient between two variables, 'hours studied' and 'exam grade', using Microsoft Excel. The speaker demonstrates how to use the Data Analysis tool in Excel to perform this calculation. The steps include selecting the 'Correlation' option from the Data Analysis menu, inputting the range of data, ensuring that variable names or labels are included, and checking the 'Labels in First Row' box. The result of the calculation is a correlation coefficient of 0.86, indicating a very strong positive correlation between the number of hours studied and the exam grade. The interpretation is that individuals who studied more tended to have higher exam grades, while those who studied less had lower grades. The speaker also mentions that the next video will focus on testing the significance of this correlation coefficient.

Mindmap

Keywords

💡Correlation Coefficient

The correlation coefficient is a statistical measure that expresses the extent to which two variables are linearly related. In the video, the correlation coefficient is used to determine the strength and direction of the relationship between the number of hours studied and the exam grade. The script mentions calculating this coefficient in Microsoft Excel to see if there's a relationship between the two variables, indicating that a high correlation would suggest that studying more hours is associated with better exam performance.

💡Microsoft Excel

Microsoft Excel is a widely used spreadsheet program that allows for data organization, manipulation, and analysis. In the context of the video, Excel is the tool chosen to calculate the correlation coefficient. The script provides a step-by-step guide on how to use Excel's Data Analysis tool to perform this calculation, highlighting Excel's capabilities in statistical analysis.

💡Data Analysis

Data analysis refers to the process of inspecting, cleaning, transforming, and modeling data to extract useful information, draw conclusions, and support decision-making. In the video, data analysis is the overarching theme, as the presenter demonstrates how to analyze the relationship between study hours and exam grades using Excel's correlation tool.

💡Input Range

In Excel, the input range refers to the cells or the area of the worksheet that contains the data to be analyzed. The script instructs the viewer to select the input range, which includes both the data points and the variable names, for the correlation calculation. This is a crucial step as it ensures that all relevant data is included in the analysis.

💡Variable Names

Variable names in a dataset are the labels given to the different columns or categories of data. In the script, the presenter selects variable names such as 'hours studied' and 'exam grade' to include in the correlation analysis. Including variable names helps in correctly interpreting the results of the correlation coefficient calculation.

💡Labels in First Row

This option in Excel's Data Analysis tool indicates that the first row of the selected range contains the labels for the variables. The script specifies checking the 'Labels in First Row' box to ensure that Excel recognizes the top row as labels, not data, which is essential for accurate correlation calculation.

💡Pearson's r

Pearson's r, or Pearson's correlation coefficient, is a measure of the linear correlation between two variables. The script mentions that the calculated correlation is 0.86, which is referred to as 'r for Pearson's r equals .86'. This value indicates a strong positive correlation, suggesting that as one variable increases, the other tends to increase as well.

💡Positive Correlation

A positive correlation implies that as one variable increases, the other variable also tends to increase. The video script uses the example of a positive correlation between the number of hours studied and the exam grade, indicating that students who study more tend to get higher grades.

💡Significance Testing

Significance testing is a statistical method used to determine if an observed relationship is unlikely to have occurred by chance. The script alludes to testing the correlation coefficient of 0.86 in a future video to see if it's significantly different from zero, which would confirm the strength and reliability of the correlation.

💡Linear Relationship

A linear relationship is a direct proportionality between two variables, which can be represented by a straight line on a graph. The video's focus on calculating the correlation coefficient is to assess the linear relationship between study hours and exam grades, as indicated by the mention of a 'very strong positive correlation'.

Highlights

Introduction to calculating the correlation coefficient in Microsoft Excel.

Explanation of the variables: hours studied and exam grade.

Objective to determine the relationship between study hours and exam grades.

Step-by-step guide to access Data Analysis and select Correlation in Excel.

Instructions on selecting the Input Range for the correlation calculation.

Importance of including variable names or labels in the selection.

Check the 'Labels in First Row' box to ensure accurate correlation calculation.

Process of obtaining the correlation result and its interpretation.

Correlation result of .86 indicating a strong positive relationship.

Interpretation of Pearson's r value of .86.

Explanation of positive correlation in the context of study hours and exam performance.

Acknowledgment that the relationship is not perfect but very strong.

Anticipation of the next video discussing the significance of the correlation value.

Teaser for the next video which will test the correlation value for statistical significance.

Emphasis on the practical application of the correlation coefficient in educational research.

Highlight of the method's potential for use in other areas beyond academic performance.

Encouragement for viewers to apply this method to their own data sets.

Transcripts

play00:00

In this video we'll take a look at how to calculate the correlation coefficient

play00:04

in Microsoft Excel. Now on your screen here we have two variables hours studied

play00:11

and that indicates the number of hours studied for an exam and then exam grade which is

play00:16

just a percentage grade on an exam. Now we want to calculate the correlation

play00:20

between these two variables to see if there's a relationship there. So do that

play00:26

we want to go to Data and then select Data Analysis and here we want to select

play00:33

Correlation and then click OK and then for Input Range what we want to do here

play00:39

is select all of our values and I'm going to go ahead and select the

play00:43

variable names as well. So click the mouse and hold the mouse button down and

play00:49

select all the cells there and I want to be sure since I did select the variable

play00:54

names or labels that I check the Labels in First Row box then click OK and

play01:02

then here I'm going to go ahead and expand this a little bit because it's

play01:04

quite small

play01:09

and then we'll go

play01:10

and round this down as well. OK so that's our correlation. I can also put it right

play01:17

here it's the same thing so let's take a look at what this is here. So the

play01:23

correlation between exam grade and our study is .86 so we could say r for

play01:33

Pearson's r equals .86. Now that indicates a very strong positive

play01:39

correlation between number of hours studied and the grade on the exam.

play01:45

So in other words the way we would interpret a positive correlation is people who

play01:49

studied more hours tended to do better on the exam and people who studied fewer

play01:55

hours tended to do worse on the exam. Now the relationship isn't perfect but it is

play02:01

very strong in this example. Now in our next video we'll test this value .86 to

play02:09

see whether it's significantly different from zero.

Rate This

5.0 / 5 (0 votes)

Étiquettes Connexes
Excel TutorialCorrelation CoefficientData AnalysisStatistical AnalysisEducational ContentStudy HoursExam GradesPositive CorrelationMicrosoft ExcelStatistical Learning
Besoin d'un résumé en anglais ?