Solve a Polynomial Inequality Graphically
Summary
TLDRThis video tutorial demonstrates how to solve polynomial inequalities using a graph. It explains that for inequalities like 'greater than or equal to zero,' one should identify intervals where the graph is above the x-axis, including points where it crosses the axis. The video also covers 'less than zero' scenarios, focusing on areas below the x-axis, excluding crossing points. Interval notation is emphasized, with examples provided for both inclusive and exclusive intervals, and set notation is briefly discussed for completeness.
Takeaways
- 📈 The video explains how to use a graph to solve polynomial inequalities.
- 🔍 For inequalities greater than or equal to zero, look for intervals where the graph is above the x-axis.
- 📌 When the inequality includes equality (e.g., greater than or equal to), include the x-intercepts in the solution.
- ➡️ Use interval notation to express the solution, starting from left to right on the graph.
- 🚫 For strict inequalities (e.g., greater than), do not include the x-intercepts.
- 🔢 If the inequality is less than zero, find the intervals where the graph is below the x-axis.
- 🔄 For less than inequalities, use parentheses to denote non-inclusive endpoints.
- 📋 In set notation, describe the intervals using 'less than' or 'greater than' language.
- 🔄 For inequalities less than or equal to zero, include the x-intercepts with brackets.
- 📉 The video provides examples of how to interpret the graph for both positive and negative y-values.
- ❓ The video encourages viewers to ask questions or request coverage of other topics.
Q & A
What is the main topic of the video?
-The main topic of the video is using a graph to solve polynomial inequalities.
What are the two scenarios discussed in the video for solving polynomial inequalities?
-The two scenarios discussed are finding when the polynomial is greater than or less than zero.
What does 'greater than or equal to zero' signify in the context of polynomial inequalities?
-In the context of polynomial inequalities, 'greater than or equal to zero' signifies looking for all x values where y is positive, including where the graph crosses the x-axis.
How does the graph help in identifying the intervals for 'greater than or equal to zero'?
-The graph helps by showing which portions of the graph are above the x-axis, indicating positive y-values, and including the points where the graph crosses the x-axis.
What is the significance of the x-axis in solving 'greater than or equal to zero' inequalities?
-The x-axis is significant because it represents the points where y equals zero, and these points are included in the solution set for 'greater than or equal to zero' inequalities.
What is the interval notation for the values of x that make y positive, according to the video?
-The interval notation includes all x values from negative infinity to negative 1, and from 1 to 3, using brackets to include the endpoints where the graph crosses the x-axis.
How does the video explain the process for finding intervals where y is less than zero?
-The video explains that for y values less than zero, one should look at the portions of the graph below the x-axis and use parentheses to indicate non-inclusive endpoints.
What is the difference between using brackets and parentheses in interval notation as per the video?
-Brackets are used to include the endpoint (for 'greater than or equal to' scenarios), while parentheses are used to exclude the endpoint (for 'less than' scenarios).
How does the video suggest representing the solution set in set notation?
-The video suggests representing the solution set in set notation by stating the set of all x values that satisfy the inequality, including or excluding the endpoints as appropriate.
What advice does the video give for viewers who have questions or need further topics covered?
-The video encourages viewers to ask questions or request additional topics for future videos.
Can you provide an example of how to interpret the graph for a 'less than zero' scenario?
-For a 'less than zero' scenario, the video suggests looking at the intervals from negative 1 to 1 (not inclusive) and from 3 to infinity, as these intervals yield negative y-values.
Outlines

Cette section est réservée aux utilisateurs payants. Améliorez votre compte pour accéder à cette section.
Améliorer maintenantMindmap

Cette section est réservée aux utilisateurs payants. Améliorez votre compte pour accéder à cette section.
Améliorer maintenantKeywords

Cette section est réservée aux utilisateurs payants. Améliorez votre compte pour accéder à cette section.
Améliorer maintenantHighlights

Cette section est réservée aux utilisateurs payants. Améliorez votre compte pour accéder à cette section.
Améliorer maintenantTranscripts

Cette section est réservée aux utilisateurs payants. Améliorez votre compte pour accéder à cette section.
Améliorer maintenantVoir Plus de Vidéos Connexes
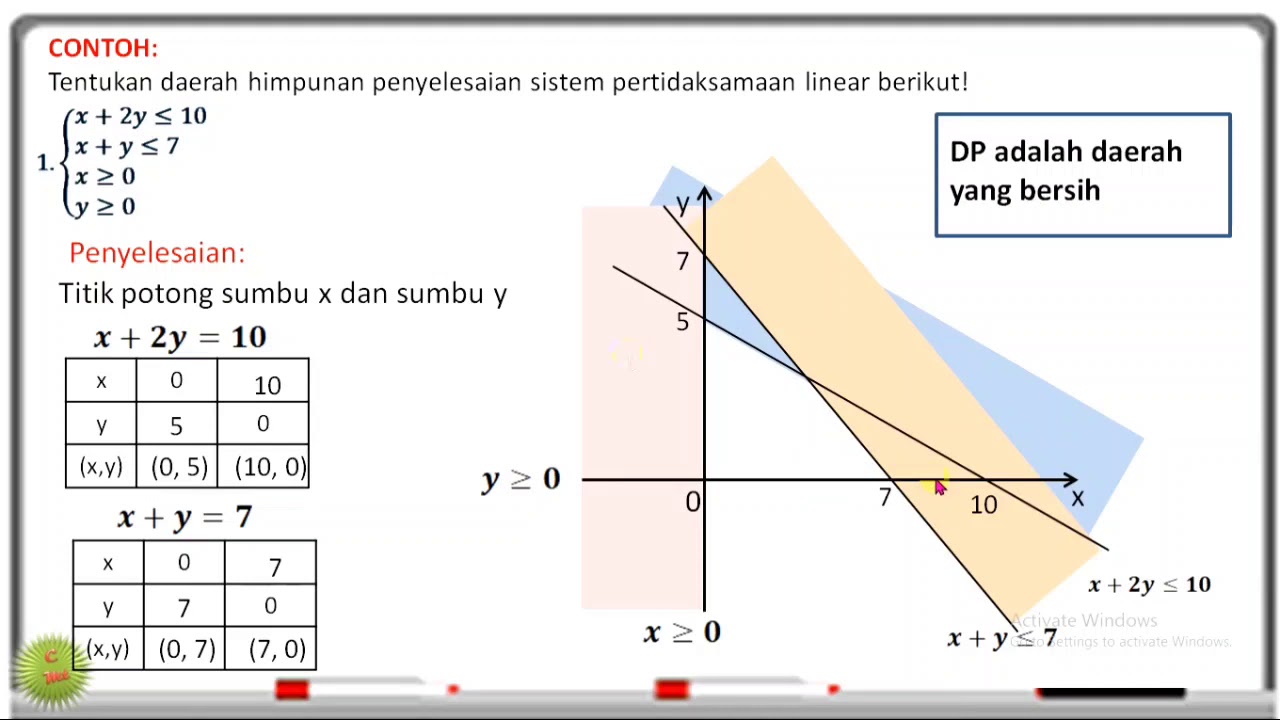
SISTEM PERTIDAKSAMAAN LINEAR DUA VARIABEL SPtLDV

Inequalities | Tagalog Tutorial Video
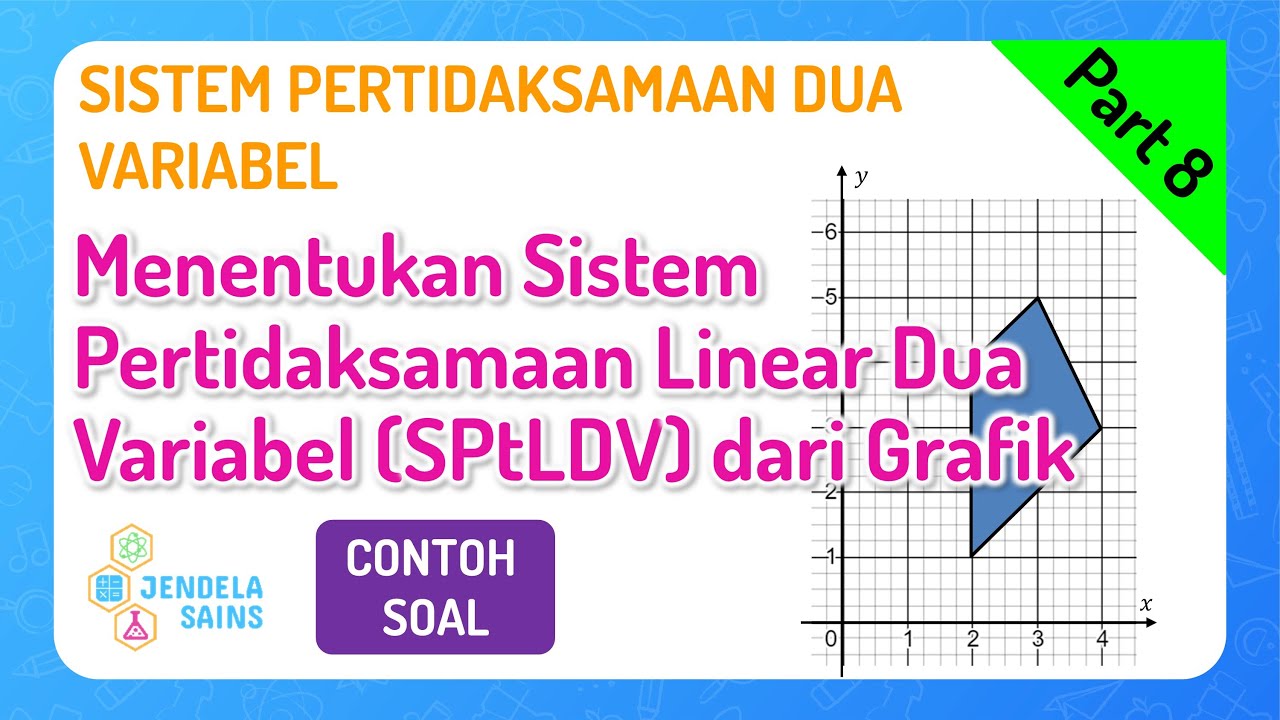
SPtDV • Part 8: Soal Menentukan Sistem Pertidaksamaan Linear Dua Variabel / SPtLDV dari Grafik (2)

Materi Sistem pertidaksamaan Linear dua Variabel (Matematika) - Bagian 1
ILLUSTRATING LINEAR INEQUALITIES IN TWO VARIABLES || GRADE 8 MATHEMATICS Q2
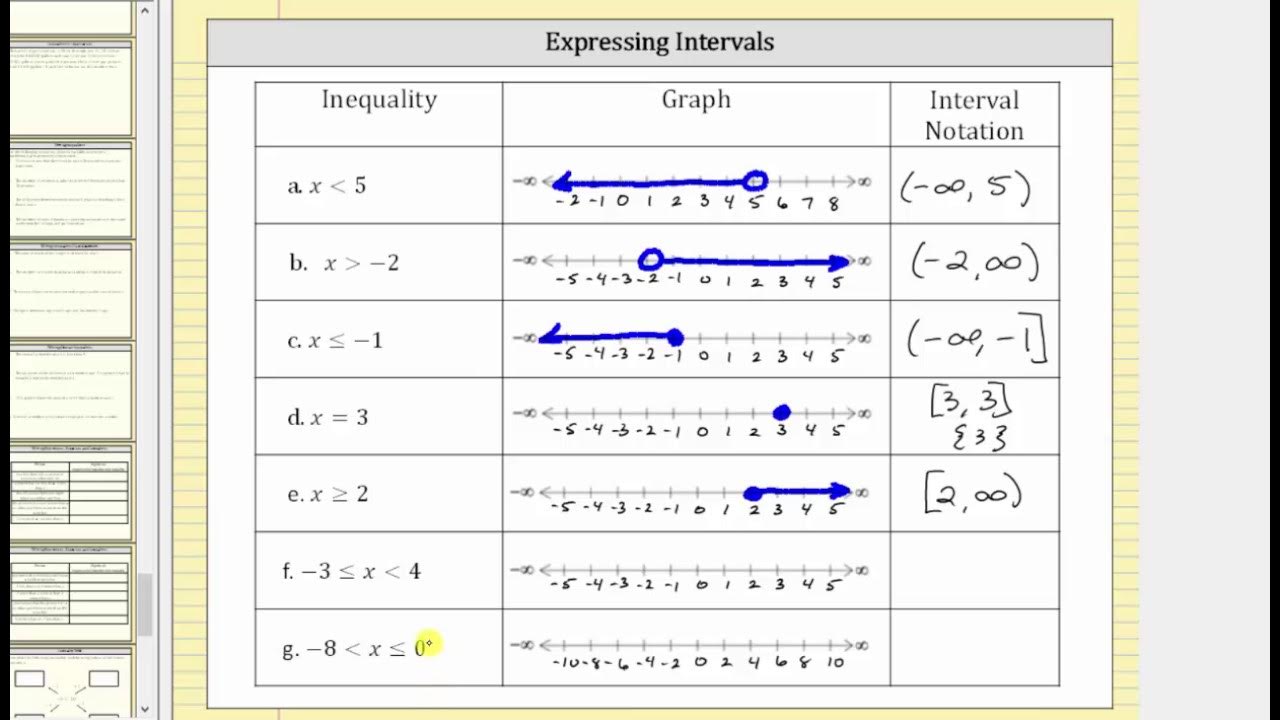
Express Inequalities as a Graph and Interval Notation
5.0 / 5 (0 votes)
