Download Rainfall Data 1901-2021 and Prepare Annual Rainfall Map
Summary
TLDRThis tutorial video guides viewers through downloading high-resolution monthly netCDF rainfall data, processing it for a specific time period, and creating an annual rainfall map. It covers extracting and compositing data bands, converting raster to point data, performing interpolation, and designing a map layout. The video is aimed at remote sensing enthusiasts and environmental solution seekers, providing a step-by-step guide to analyze rainfall data effectively.
Takeaways
- 🌍 The video provides a tutorial on downloading high-resolution netCDF monthly rainfall data for a specific region.
- 📅 It covers the process for the period from 1901 to 2020, with the data version released on 17th March 2021.
- 💾 The tutorial includes instructions on how to process daily netCDF files and separate composite bands.
- 📊 It demonstrates how to calculate annual rainfall and convert raster to point data.
- 🗺️ The video guides viewers on how to perform interpolation to create an annual rainfall map layout according to the area of interest.
- 🖥️ It involves using ArcMap and its toolbox to create a netCDF raster layer from the downloaded data.
- 🔄 The process includes exporting data, renaming layers, and adjusting the data frame to match the projected coordinate system.
- 🔢 The tutorial shows how to composite bands from a 10-year data set to create a single annual rainfall map.
- 📏 It explains the use of cell statistics to aggregate monthly data into an annual total.
- 📊 The video covers the conversion of raster data to point data for further analysis.
- 🔄 The tutorial includes using interpolation methods such as Inverse Distance Weighting (IDW) for creating a more detailed rainfall map.
- 🎨 Finally, it guides on creating a map layout with appropriate symbols, legends, and other map elements for the final annual rainfall map of 2020.
Q & A
What is the main topic of the video?
-The main topic of the video is demonstrating the process of downloading high-resolution netCDF monthly rainfall data, processing it, and creating an annual rainfall map layout according to the area of interest.
Which dataset does the video guide viewers to download?
-The video guides viewers to download the 'high resolution gradient dataset' which covers the period from 1901 to 2020.
What software is used to process the netCDF files in the video?
-ArcMap is the software used to process the netCDF files as demonstrated in the video.
How does the video instruct to extract and process the precipitation data?
-The video instructs to extract and process the precipitation data by using the 'Make NetCDF Raster Layer' tool in ArcMap, selecting the precipitation variable, and setting the x and y dimensions.
What coordinate system does the video suggest changing to?
-The video suggests changing the coordinate system to UTM, Northern Hemisphere, Zone 46N.
How does the video demonstrate the creation of a composite band for annual rainfall?
-The video demonstrates the creation of a composite band for annual rainfall by selecting the last 12 bands from the dataset and using the 'Composite Bands' tool in ArcMap.
What tool is used to convert raster data to point data in the video?
-The 'Raster to Point' tool is used to convert raster data to point data in the video.
What interpolation method is used in the video to create the annual rainfall map?
-The video uses the Inverse Distance Weighting (IDW) method for interpolation to create the annual rainfall map.
How does the video guide creating a map layout for the annual rainfall map?
-The video guides creating a map layout by inserting a title, changing symbol sizes, adding a legend, adjusting symbology, and customizing the north arrow and scale bar.
What are the steps to save the final annual rainfall map according to the video?
-The steps to save the final annual rainfall map include editing properties, changing font sizes, level offsets, and intervals, and exporting the map in various formats with a selected resolution.
Outlines

Cette section est réservée aux utilisateurs payants. Améliorez votre compte pour accéder à cette section.
Améliorer maintenantMindmap

Cette section est réservée aux utilisateurs payants. Améliorez votre compte pour accéder à cette section.
Améliorer maintenantKeywords

Cette section est réservée aux utilisateurs payants. Améliorez votre compte pour accéder à cette section.
Améliorer maintenantHighlights

Cette section est réservée aux utilisateurs payants. Améliorez votre compte pour accéder à cette section.
Améliorer maintenantTranscripts

Cette section est réservée aux utilisateurs payants. Améliorez votre compte pour accéder à cette section.
Améliorer maintenantVoir Plus de Vidéos Connexes
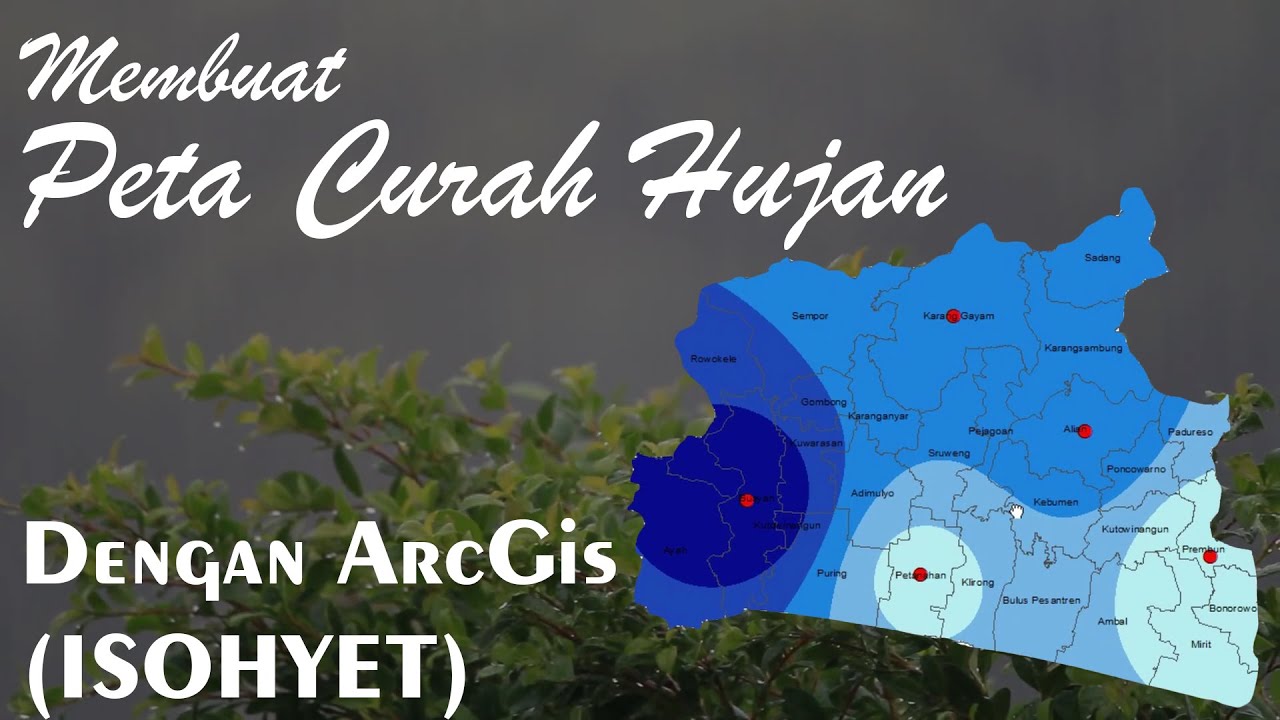
MEMBUAT PETA CURAH HUJAN ISOHYET DI ARCGIS
Tutorial Membuat Peta Erosi Secara Spasial Menggunakan Arcgis dengan rumus USLE

Cara Menentukan Iklim Schmidt Ferguson
Create Advance PDF Reports in Oracle APEX Comprising Grouping | Chart | Pivot Table - Part 33

Cara Membuat Peta Potensi Air Tanah Menggunakan ArcGIS

How to download earthquake records for the time-history analysis from PEER Ground Motion Database
5.0 / 5 (0 votes)
