Cooling curve vs Heating curve Grade 10 Chemistry
Summary
TLDRThis educational video script explores the concepts of heating and cooling curves, illustrating how substances change temperature and phase with added or removed heat. It explains that during a heating curve, substances transition from solid to liquid to gas, with temperature remaining constant during phase changes, while kinetic and potential energies shift. Conversely, the cooling curve demonstrates the reverse process, where substances move from gas to liquid to solid, with temperature changes reflecting kinetic energy variations and phase changes indicating potential energy alterations. The script emphasizes the importance of understanding these energy transformations in thermodynamics.
Takeaways
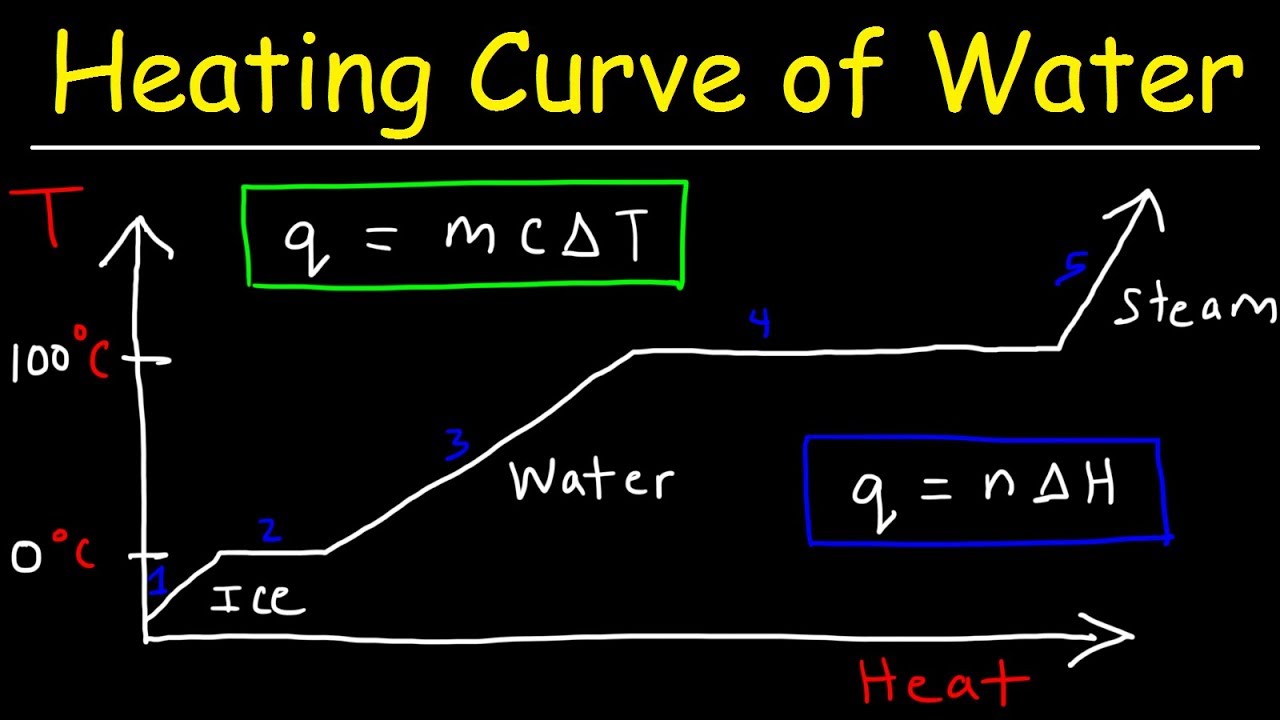
- 🌡️ The heating curve tracks the temperature changes of a substance as heat is added over time, starting from a solid phase.
- 🔥 When a substance is heated and undergoes a phase change, such as melting or boiling, the temperature remains constant on the heating curve despite continuous heat absorption.
- 📈 The inclined parts of the heating curve represent an increase in kinetic energy and temperature, indicating the substance is in a single phase (solid, liquid, or gas).
- 🔄 The flat parts of the heating curve signify a phase change where the absorbed heat energy is used to overcome intermolecular forces, increasing potential energy without a change in temperature.
- 🌀 The cooling curve is the reverse process of the heating curve, starting with a gas and ending with a solid as heat is removed.
- ❄️ During the cooling curve, the substance transitions from gas to liquid (condensation) and then from liquid to solid (freezing), with temperature remaining constant during these phase changes.
- 🔽 As heat is removed in the cooling process, the kinetic energy of the particles decreases, leading to a drop in temperature, which is represented by the inclined parts of the cooling curve.
- 🔄 Similar to the heating curve, the horizontal parts of the cooling curve indicate that kinetic energy remains constant while potential energy decreases due to the phase change.
- 📊 Understanding the heating and cooling curves is crucial for interpreting changes in a substance's state and energy during phase transitions.
- 🎓 The video emphasizes the importance of knowing how to read, interpret, and draw heating and cooling curves for a comprehensive understanding of thermodynamics.
Q & A
What is a heating curve and how does it relate to the temperature changes of a substance?
-A heating curve is a graphical representation that shows the changes in temperature of a substance over time when heat is added. It starts with the substance in a solid phase, and as heat is added, the temperature increases until a phase change occurs, such as melting or boiling, where the temperature remains constant despite continued heat absorption.
How does the temperature change during the phase change in a heating curve?
-During a phase change on a heating curve, such as melting or boiling, the temperature of the substance remains constant even though heat is being absorbed. This is because the absorbed energy is used to change the state of the substance rather than to increase its kinetic energy.
What is the significance of a horizontal line on a heating curve?
-A horizontal line on a heating curve indicates a phase change where the substance is transitioning from one state to another, such as from solid to liquid or from liquid to gas. During this phase change, the temperature stays constant despite heat being absorbed.
What happens to the kinetic energy of particles when a substance is heated and its temperature increases?
-When a substance is heated and its temperature increases, the kinetic energy of its particles also increases. This is because the added heat energy increases the average kinetic energy of the particles, causing them to move faster.
How does the potential energy of a substance change during a phase change on a heating curve?
-During a phase change on a heating curve, the potential energy of a substance increases. This is because the absorbed heat energy is used to overcome the intermolecular forces, allowing the particles to move further apart and change states.
What is the relationship between heat absorption and temperature increase on an incline part of a heating curve?
-On an incline part of a heating curve, heat absorption leads to an increase in temperature. This is because the absorbed heat energy increases the kinetic energy of the particles, which in turn raises the average kinetic energy and thus the temperature of the substance.
Can you explain the concept of a cooling curve and how it differs from a heating curve?
-A cooling curve is the reverse of a heating curve. It represents the temperature changes of a substance over time when heat is removed. It starts with the substance in a gaseous state and ends in a solid state, with phase changes occurring at specific temperatures where the substance changes from gas to liquid and then from liquid to solid.
What does a horizontal line on a cooling curve signify?
-A horizontal line on a cooling curve signifies a phase change where the substance is transitioning from one state to another, such as from gas to liquid or from liquid to solid. During this phase change, the temperature remains constant despite heat being released.
How does the kinetic energy of particles change during the cooling process depicted on a cooling curve?
-During the cooling process on a cooling curve, the kinetic energy of the particles decreases as the substance loses heat. This results in a decrease in the average kinetic energy and thus a decrease in temperature.
What is the role of potential energy in the phase changes observed on a cooling curve?
-On a cooling curve, the potential energy of a substance decreases during phase changes. As heat is released and the substance transitions from one state to another, the particles move closer together, and the intermolecular forces become stronger, which is reflected in the decrease of potential energy.
How can one interpret the incline and horizontal parts of a cooling curve in terms of energy changes?
-On a cooling curve, incline parts indicate a change in kinetic energy and thus a change in temperature as the substance cools down in a single phase. Horizontal parts indicate phase changes where the kinetic energy remains constant, but the potential energy changes due to the particles moving closer together.
Outlines

Cette section est réservée aux utilisateurs payants. Améliorez votre compte pour accéder à cette section.
Améliorer maintenantMindmap

Cette section est réservée aux utilisateurs payants. Améliorez votre compte pour accéder à cette section.
Améliorer maintenantKeywords

Cette section est réservée aux utilisateurs payants. Améliorez votre compte pour accéder à cette section.
Améliorer maintenantHighlights

Cette section est réservée aux utilisateurs payants. Améliorez votre compte pour accéder à cette section.
Améliorer maintenantTranscripts

Cette section est réservée aux utilisateurs payants. Améliorez votre compte pour accéder à cette section.
Améliorer maintenantVoir Plus de Vidéos Connexes
Heating Curve and Cooling Curve of Water - Enthalpy of Fusion & Vaporization

The Heating and Cooling Curve of a Substance

2.5 Heating/Cooling Curves (Potential and Kinetic Energy Changes)

Heating Curves and Cooling Curves

Heating Curve Grade 10: Kinetic Molecular Theory

lesson 7 4 calculating heat of phase changes
5.0 / 5 (0 votes)
