Median, Mean, Mode, Range from a Frequency Table - Maths Angel
Summary
TLDRThis educational video script explores the extraction of key statistical measures from a frequency table, using a real-world example of students' pet ownership. It explains how to calculate the mean by summing the products of values and frequencies, resulting in a mean of 1.6 pets per student. The median, found at the eighth value, is one pet. The mode, the most frequent value, is also one pet, occurring six times. The range is determined by the difference between the maximum (nine pets) and minimum (zero pets), highlighting the impact of outliers on the mean. The script emphasizes the reliability of the median as a measure less affected by extreme values.
Takeaways
- 📊 The video discusses four key measurements of a dataset: mean, median, mode, and range.
- 📈 Mean is calculated by summing all values, multiplying each by its frequency, and dividing by the total number of students (15 in this case).
- 🔢 The median is found by determining the middle value in the dataset, which is the 8th number in this example.
- 🧩 The mode is the value that appears most frequently, which is one pet in this scenario.
- 📉 The range is the difference between the maximum and minimum values in the dataset, calculated as 9 - 0 = 9.
- 👀 Frequency tables simplify the process of finding mean by allowing for quick summation through multiplication of values by their frequencies.
- 📋 The video uses a real-world example of a frequency table showing the number of pets owned by students to illustrate these concepts.
- 📌 Outliers, such as the value nine in this case, can significantly affect the mean but have less impact on the median.
- 📉 The median is less affected by outliers and is considered more reliable and representative of the dataset's central tendency.
- 🔎 The video emphasizes the importance of understanding how outliers can distort the mean and why the median might be a better measure in such cases.
Q & A
What are the four key measurements used to describe a dataset?
-The four key measurements used to describe a dataset are mean, median, mode, and range.
How can you determine the mean from a frequency table?
-To determine the mean from a frequency table, multiply each value by its frequency to get the sum of all values, then divide by the total number of observations.
What is the mean number of pets owned by students in the given example?
-The mean number of pets owned by students in the example is 1.6 pets per student.
How do you find the median in a dataset represented by a frequency table?
-To find the median, locate the middle value when the data is sorted. If the total number of values is odd, the median is the middle number. If even, it's the average of the two middle numbers.
What is the median number of pets owned by students in the provided example?
-The median number of pets owned by students in the example is one pet, as it is the eighth value when the data is sorted.
What is the mode in the context of the frequency table discussed in the script?
-The mode in the context of the frequency table is the value that appears most frequently. In the example, the mode is one pet, as it is owned by six students.
How is the range calculated from a frequency table?
-The range is calculated by finding the difference between the maximum and minimum values in the dataset.
What is the range of the number of pets owned by students in the example?
-The range of the number of pets owned by students in the example is nine, which is the difference between the maximum value (nine pets) and the minimum value (zero pets).
Why does the presence of an outlier like the value nine significantly affect the mean?
-The presence of an outlier like the value nine significantly affects the mean because it is much larger than the other values, pulling the mean higher and causing it to be less representative of the central tendency of the data.
How is the median less affected by outliers compared to the mean?
-The median is less affected by outliers because it is the middle value of the dataset and is not influenced by the magnitude of extreme values, making it a more reliable measure of central tendency.
What is the significance of the difference between the mean and median in the given example?
-The difference between the mean and median in the example highlights that the mean can be heavily distorted by outliers, while the median remains a more stable and representative measure of the central tendency of the data.
Outlines

Cette section est réservée aux utilisateurs payants. Améliorez votre compte pour accéder à cette section.
Améliorer maintenantMindmap

Cette section est réservée aux utilisateurs payants. Améliorez votre compte pour accéder à cette section.
Améliorer maintenantKeywords

Cette section est réservée aux utilisateurs payants. Améliorez votre compte pour accéder à cette section.
Améliorer maintenantHighlights

Cette section est réservée aux utilisateurs payants. Améliorez votre compte pour accéder à cette section.
Améliorer maintenantTranscripts

Cette section est réservée aux utilisateurs payants. Améliorez votre compte pour accéder à cette section.
Améliorer maintenantVoir Plus de Vidéos Connexes

STATISTIKA : nilai jangkauan banyak kelas panjang kelas dan menyusun tabel distribusi frekuensi

The Maths Prof: Frequency Tables (Mean, Median, Mode & Range)
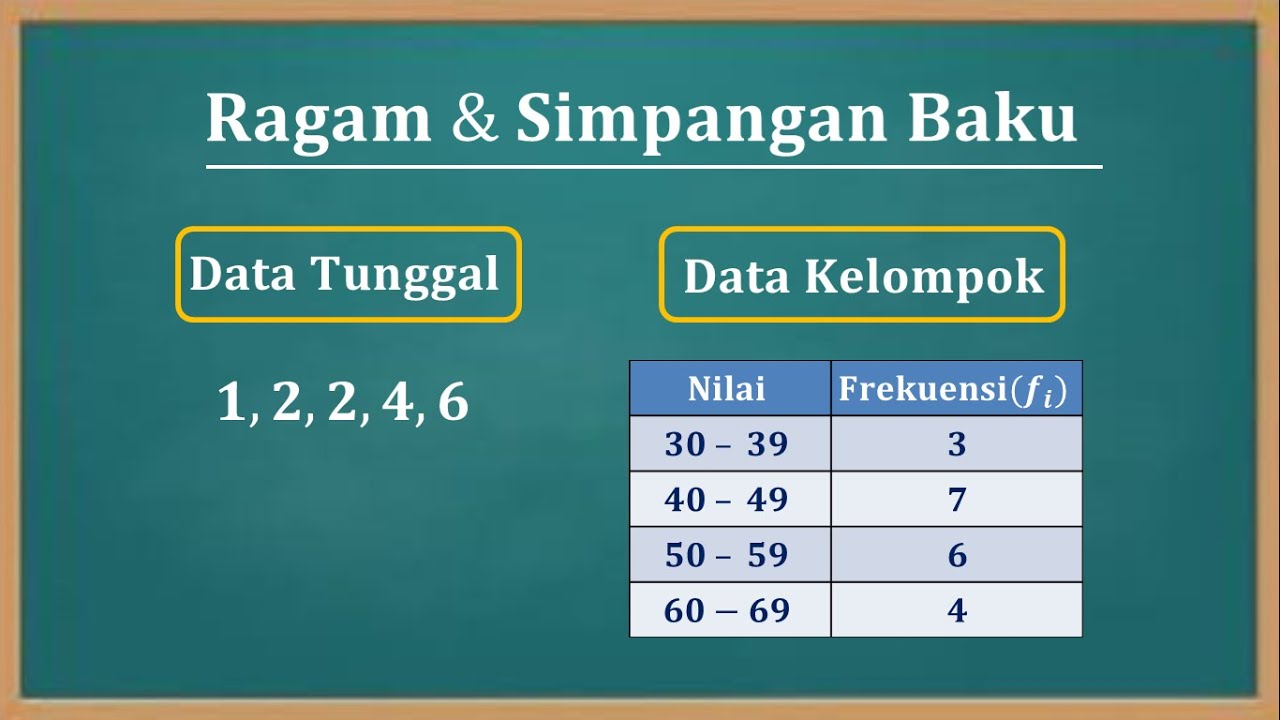
Cara menentukan nilai varian (Ragam) dan Standar deviasi (Simpangan baku) data tunggal dan kelompok
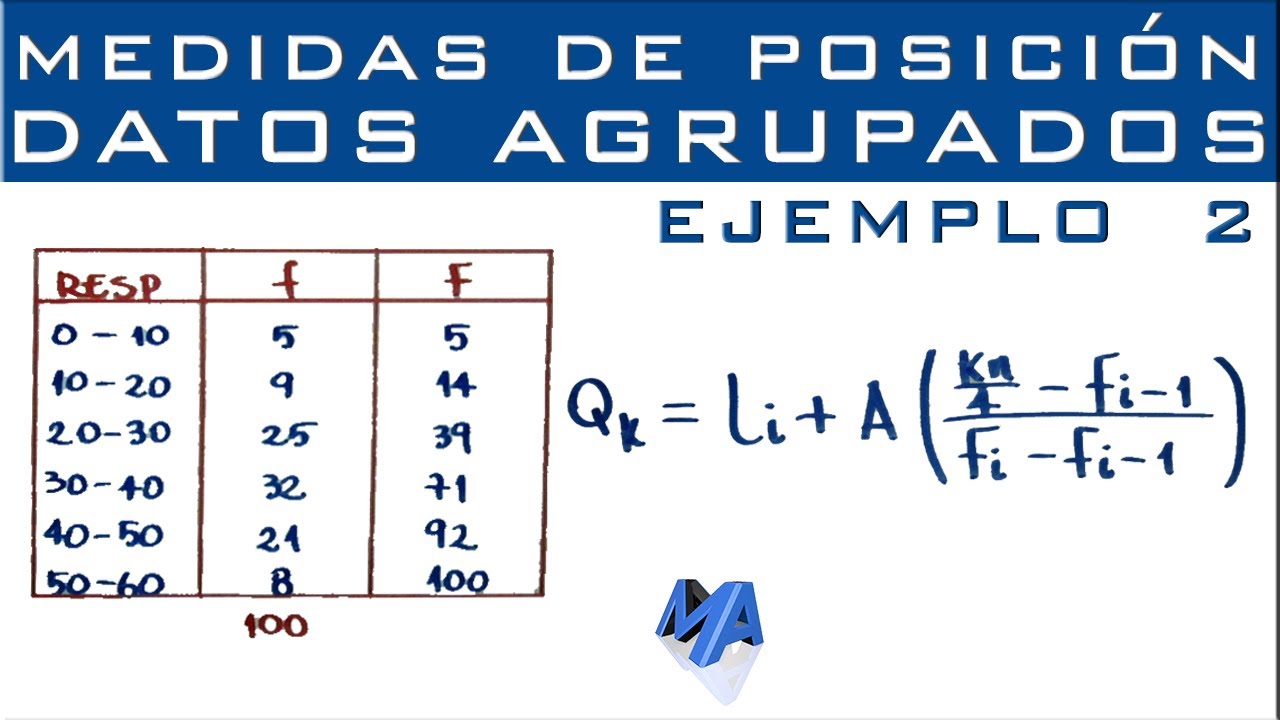
Cuartiles, Deciles y Percentiles | Datos agrupados en intervalos | Ejemplo 2
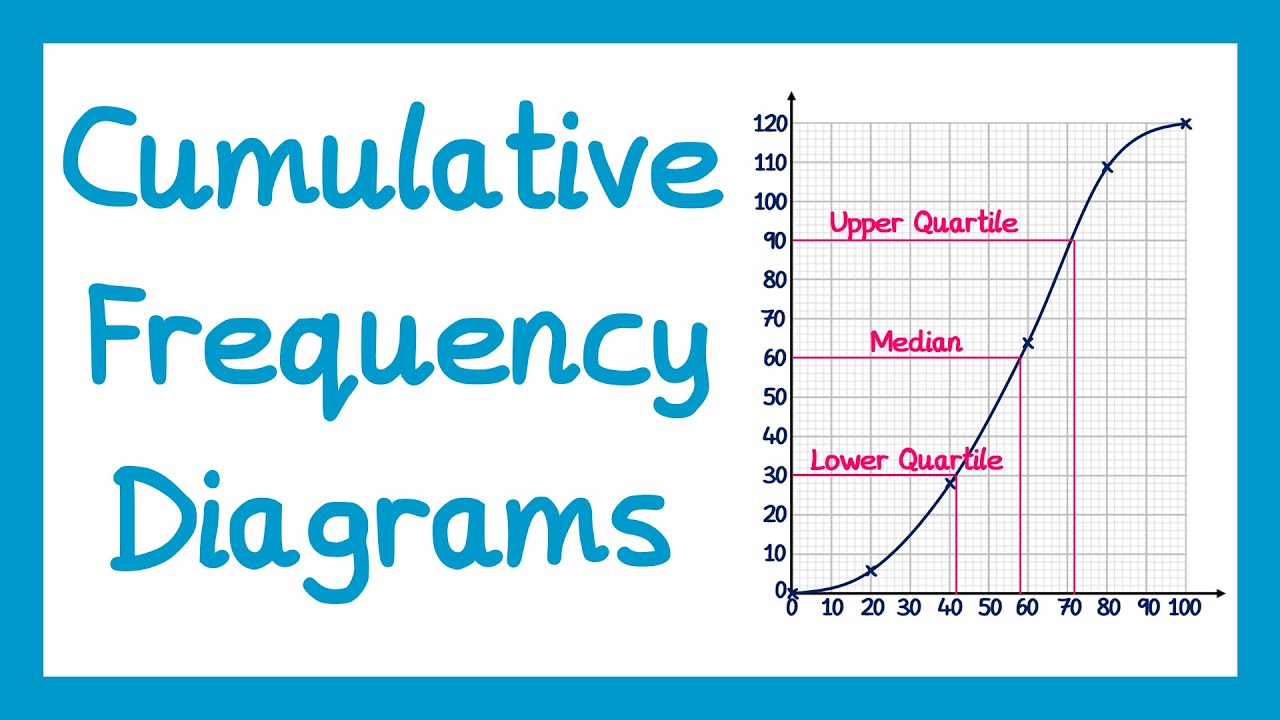
Cumulative Frequency Diagrams - GCSE Higher Maths

Ukuran Penyebaran Data | Statistika Kelas 8
5.0 / 5 (0 votes)
