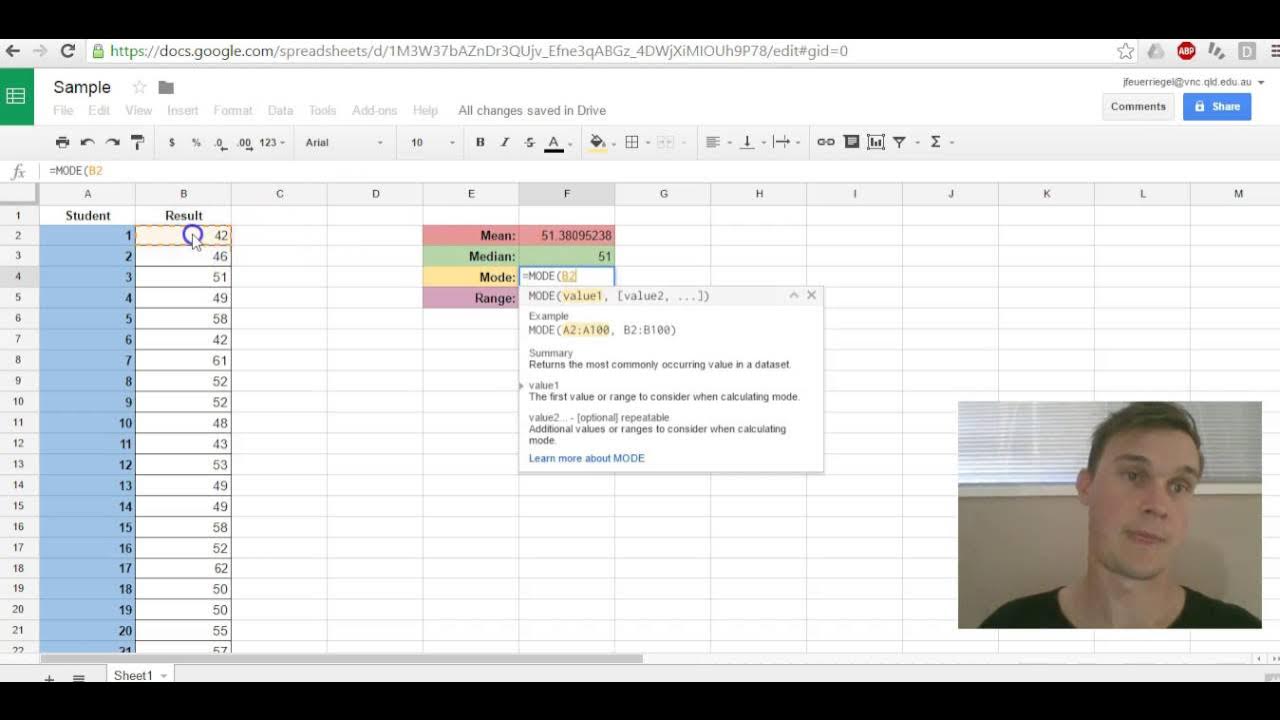
The Maths Prof: Frequency Tables (Mean, Median, Mode & Range)
Summary
TLDRIn this educational video, the instructor demonstrates how to calculate the mean, median, mode, and range from frequency tables using real-world examples. The video walks through two key examples: rolling a dice 50 times and the test scores of 35 students. For each, the instructor explains how to compute these statistical measures step by step, emphasizing practical tips and strategies for handling large datasets without making errors. The tutorial is designed to make concepts like averages and range clear and accessible, with a focus on ensuring results are sensible and fall within expected ranges.
Takeaways
- 😀 Frequency tables are useful for summarizing large datasets and simplifying statistical calculations.
- 😀 The mean is calculated by multiplying each value by its frequency, adding the products together, and dividing by the total number of data points.
- 😀 The median is the middle value in a dataset, and if there is an even number of data points, the median is the average of the two middle values.
- 😀 The mode is the value that appears most frequently in the dataset. It's identified by the highest frequency.
- 😀 The range is the difference between the highest and lowest values in the dataset.
- 😀 When calculating the mean using a frequency table, multiplying the value by its frequency is equivalent to writing the value multiple times.
- 😀 Always check that your mean, median, and mode make sense based on the range of possible values in the dataset.
- 😀 In cases where the number of data points is odd, you can find the median by adding one to the total and dividing by two to determine the middle position.
- 😀 The example with the dice rolls demonstrates the application of mean, median, mode, and range in a practical scenario.
- 😀 It’s important to show your working out during calculations to help identify and correct any mistakes.
- 😀 When using a calculator, remember to put brackets around the numerator part when dividing to ensure the correct result.
Q & A
What is the main purpose of using a frequency table in this video?
-The main purpose of using a frequency table is to simplify calculations when working with a large set of data, especially when listing out all individual numbers is impractical.
How does the frequency table help in calculating the mean of the data?
-The frequency table helps by multiplying each number by its corresponding frequency, then summing these results. Finally, the total is divided by the total number of data points to find the mean.
What is the formula to calculate the mean in a frequency table?
-The formula to calculate the mean is: (Sum of (number × frequency)) ÷ Total number of data points.
Why is it important to check the calculation brackets when dividing in a calculator?
-It's important to use brackets around the numerator when dividing to ensure the entire sum is divided by the total number of data points, not just the final number in the sum.
What happens if there is an even number of data points when finding the median?
-When there is an even number of data points, there are two middle values. The median is found by averaging the two middle numbers.
How is the median calculated when the number of data points is odd?
-For an odd number of data points, the median is the middle value. To find this middle value, divide the total number of data points by 2 and round up if necessary to identify the exact middle position.
What is the mode in the context of a frequency table?
-The mode is the number that appears most frequently in the data set. In the frequency table, it corresponds to the number with the highest frequency.
How is the range of a data set determined?
-The range is calculated by subtracting the smallest value from the largest value in the data set.
Why is it important to ensure that all average values fall within the range of possible values in a frequency table?
-It's important to ensure that the averages are sensible, meaning they fall between the smallest and largest possible values in the data set, to confirm that the calculations are correct.
In the second example, what is the significance of rounding the mean to three significant figures?
-Rounding the mean to three significant figures ensures the result is concise and practical for real-world interpretation, while still maintaining accuracy based on the data provided.
Outlines

This section is available to paid users only. Please upgrade to access this part.
Upgrade NowMindmap

This section is available to paid users only. Please upgrade to access this part.
Upgrade NowKeywords

This section is available to paid users only. Please upgrade to access this part.
Upgrade NowHighlights

This section is available to paid users only. Please upgrade to access this part.
Upgrade NowTranscripts

This section is available to paid users only. Please upgrade to access this part.
Upgrade NowBrowse More Related Video

Cara menyusun tabel distribusi frekuensi, menentukan mean, median dan modus data kelompok

MÉDIA, MODA E MEDIANA | MEDIDAS DE TENDÊNCIA CENTRAL \Prof. Gis/

MAT 152 SAS 8 Video

STATISTIKA CARA MENCARI NILAI MEAN, MEDIAN, MODUS DATA KELOMPOK PART 1

Google Sheets Mean,Median,Mode,Range

Median, Mean, Mode, Range from a Frequency Table - Maths Angel
5.0 / 5 (0 votes)