How to set up Visual Studio Code for Executing and Debugging C Programs | Tutorial
Summary
TLDRThis tutorial offers a comprehensive guide on setting up Visual Studio Code for C programming, including writing, executing, and debugging C programs. It covers the installation of necessary tools, workspace setup, and the use of extensions like 'C/C++' for enhanced functionality. The video demonstrates creating a build task, generating executable files, and running them directly from VS Code. Additionally, it explains how to debug programs using breakpoints and the gdb debugger, providing a step-by-step approach to mastering C development in VS Code.
Takeaways
- 📘 The tutorial is about setting up Visual Studio Code for writing, executing, and debugging C programs.
- 🔧 An alternative quick method for writing and executing C programs using the Code Runner extension is mentioned, with a link provided in the description box.
- 💻 Requirements include having Visual Studio Code installed, along with the C tool set and debugger.
- 🛠️ Users are guided to verify the installation of gcc and gdb by using command prompt and checking for version numbers.
- 📁 The process of setting up a workspace in Visual Studio Code involves creating folders for organizing C program files.
- 📝 The creation of a 'hello world' C program is demonstrated, including writing a simple program to ask for the user's age and display it.
- 🔌 An extension called 'C/C++' developed by Microsoft is recommended for enhanced C/C++ support in Visual Studio Code.
- ⚙️ The tutorial explains how to configure a build task in Visual Studio Code to generate an executable file from a C source file.
- 💼 The video shows how to modify the task.json file to include additional compiler arguments and to handle spaces in file and folder names.
- 🚀 The script describes how to execute the generated executable file from within Visual Studio Code using the terminal.
- 🔄 A trick to modify the task for building and running the program directly without separate steps is shared.
- 🐞 Debugging in Visual Studio Code is covered, including setting breakpoints, using the gdb debugger, and interpreting debug console output.
Q & A
What is the main purpose of the tutorial in the script?
-The main purpose of the tutorial is to guide users on how to set up Visual Studio Code for writing, executing, and debugging C programs.
Is there an alternative method mentioned for writing and executing a C program quickly?
-Yes, an alternative method is mentioned which involves using the Code Runner extension for quickly writing and executing a C program.
What are the prerequisites before starting with the tutorial?
-The prerequisites include having Visual Studio Code installed, the C tool set with the debugger, and ensuring that gcc and gdb are properly installed and the path environment variable is set.
How can one check if gcc is installed and the path is set correctly?
-One can check by opening the command prompt and typing 'gcc --version'. If gcc is installed and the path is set correctly, the version will be displayed; otherwise, an error message will indicate that gcc is not recognized.
What debugger is used in the tutorial for C programs?
-The tutorial uses the gdb debugger for C programs.
How does one verify if gdb is installed?
-To verify if gdb is installed, one can type 'gdb --version' in the command prompt. If gdb is installed, the version number will be displayed; otherwise, an error message will indicate that gdb is not recognized.
What is the first step in setting up the workspace in Visual Studio Code according to the tutorial?
-The first step is to open Visual Studio Code, click on 'File', then 'Add Folder to Workspace', and choose or create a folder where the C program files will be saved.
What is the purpose of the 'C/C++' extension in Visual Studio Code mentioned in the script?
-The 'C/C++' extension developed by Microsoft provides C/C++ intelligence, debugging, and code browsing features in Visual Studio Code.
How does one create a build task for a C program in Visual Studio Code?
-One creates a build task by clicking on 'Terminal', then 'Configure Default Build Task', and following the prompts to set up the task, which includes specifying the compiler and build arguments.
What is the significance of the 'launch.json' file in debugging a C program?
-The 'launch.json' file is used to configure the debugger settings in Visual Studio Code. It is automatically generated by the C/C++ extension and can be edited to customize the debugging process.
How can one run a C program directly from the source file without creating an executable first?
-One can modify the build task to include commands that both build the executable file and run it directly. This is done by setting up a shell task in the 'tasks.json' file with the necessary gcc command and execution command.
What is the process of adding a breakpoint in Visual Studio Code for debugging a C program?
-To add a breakpoint, one clicks on the margin next to the line number in the source code where the breakpoint is desired. A red dot appears, indicating the breakpoint has been set.
How can the user specify a particular C/C++ configuration in Visual Studio Code?
-The user can specify a particular C/C++ configuration by editing the 'c_cpp_properties.json' file, which can be accessed through the 'View', 'Command Palette', and searching for 'C/C++: Edit Configurations (UI)'.
Outlines

Esta sección está disponible solo para usuarios con suscripción. Por favor, mejora tu plan para acceder a esta parte.
Mejorar ahoraMindmap

Esta sección está disponible solo para usuarios con suscripción. Por favor, mejora tu plan para acceder a esta parte.
Mejorar ahoraKeywords

Esta sección está disponible solo para usuarios con suscripción. Por favor, mejora tu plan para acceder a esta parte.
Mejorar ahoraHighlights

Esta sección está disponible solo para usuarios con suscripción. Por favor, mejora tu plan para acceder a esta parte.
Mejorar ahoraTranscripts

Esta sección está disponible solo para usuarios con suscripción. Por favor, mejora tu plan para acceder a esta parte.
Mejorar ahoraVer Más Videos Relacionados
Set Up C++ Development With Visual Studio Code on Mac | VSCode C++ Development Basics MacOS (2024)
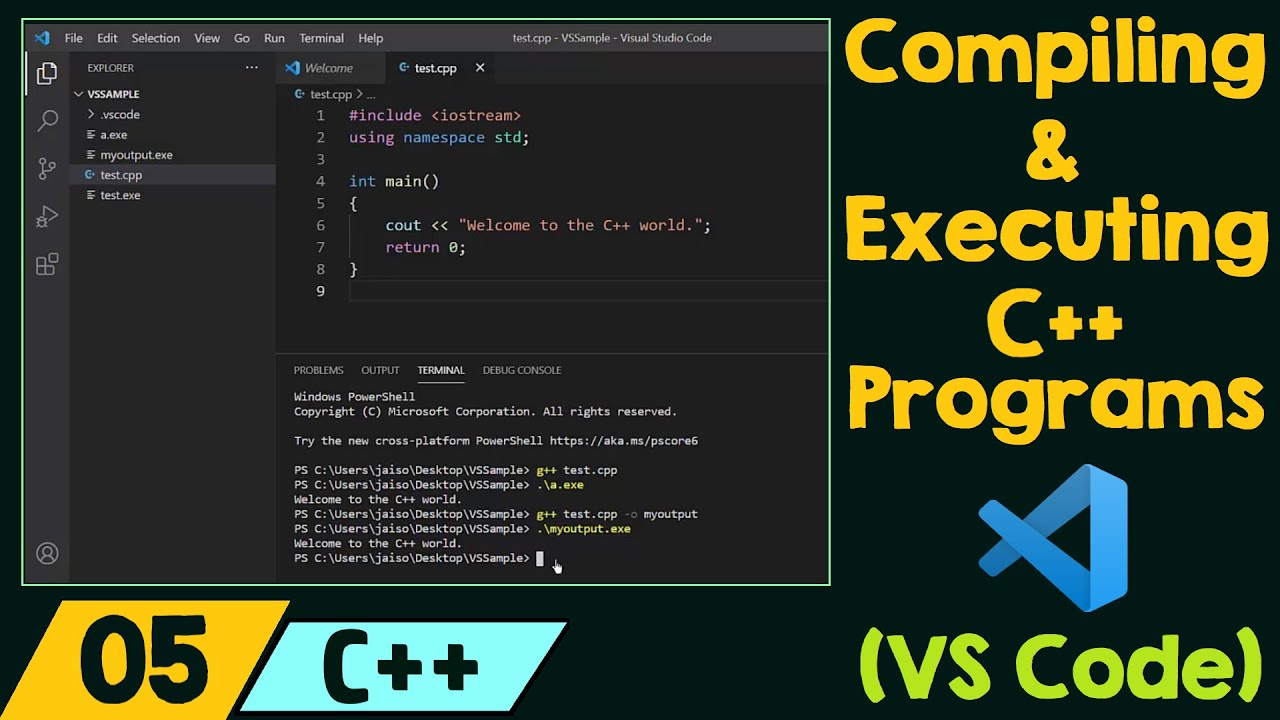
Compiling & Executing C++ Programs (VS Code)
CARA DOWNLOAD VISUAL STUDIO CODE WINDOWS 11 DAN INSTALL EXTENSION BAHASA C DAN C++ BESERTA COMPILER

How to set up C++ in Visual Studio Code
How To Install C Programming Software In Laptop | C Installation Tutorial For Beginners |Simplilearn
#01 - Creating A Project | UE5 C++ Tutorial
5.0 / 5 (0 votes)
