Materi Sistem pertidaksamaan Linear dua Variabel (Matematika) - Bagian 1
Summary
TLDRIn this video, the concept of linear inequalities in two variables is explored. The presenter defines these inequalities and demonstrates how to solve them by converting the inequality into an equation, finding intercepts, and plotting the solution on a coordinate plane. The process includes distinguishing between solid and dashed lines based on the inequality symbol, and using test points to identify the solution region. The video provides clear examples of linear inequalities and explains how to graph the solution areas effectively. This serves as an introduction to solving linear inequalities graphically.
Takeaways
- 😀 Linear inequalities in two variables involve two variables raised to the first power and are expressed using symbols like ≥, >, ≤, or <.
- 😀 The general form of a linear inequality in two variables is ax + by ≥ c, ax + by > c, ax + by ≤ c, or ax + by < c.
- 😀 'a', 'b', and 'c' are real numbers, and 'a' and 'b' cannot both be 0 in the inequality's general form.
- 😀 To graph a linear inequality, first convert it to an equation by changing the inequality sign to equality.
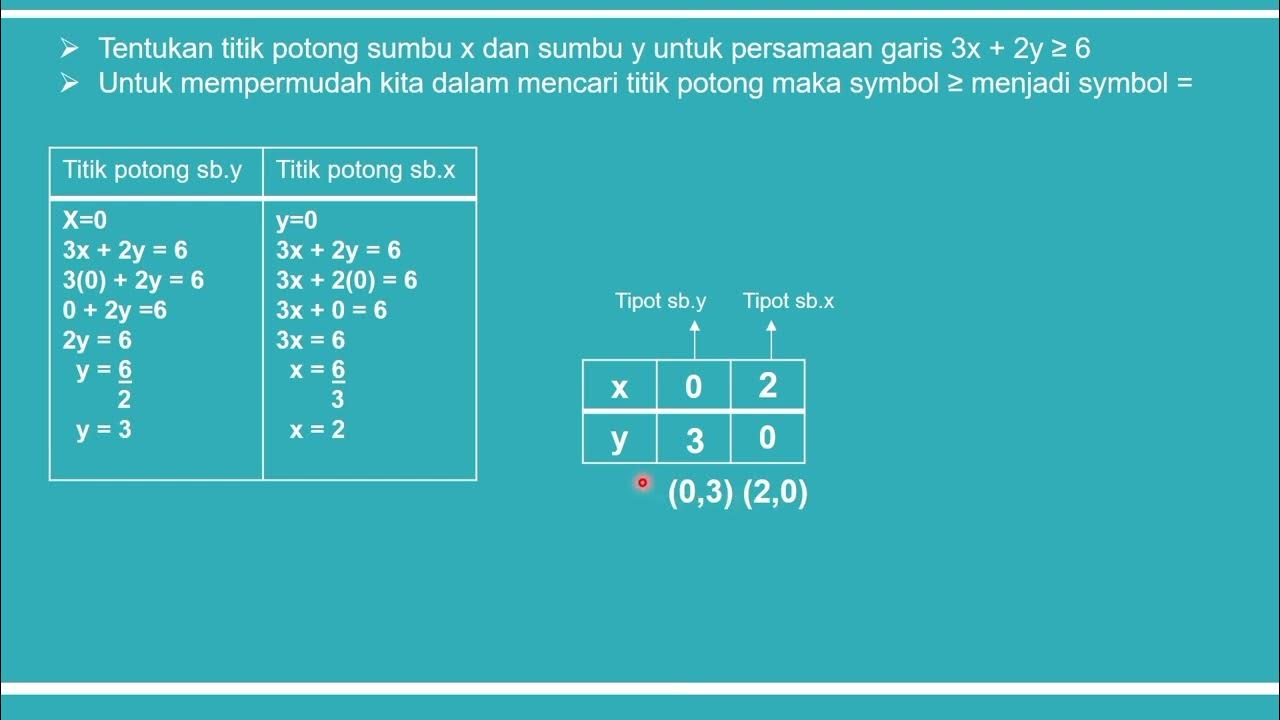
- 😀 Finding the x- and y-intercepts is key to plotting the line of the inequality on a Cartesian plane.
- 😀 After plotting the intercepts, draw a line connecting the points. The line is solid if the inequality is ≥ or ≤, and dashed if it is > or <.
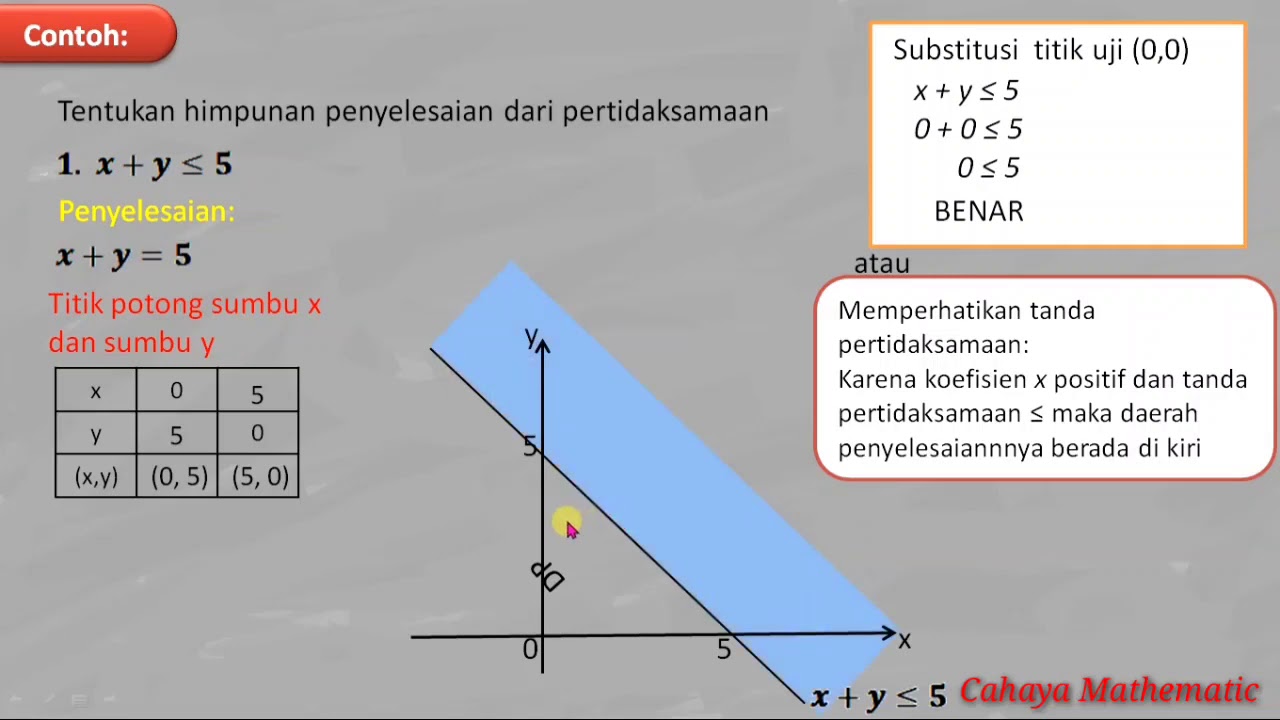
- 😀 To determine the solution region, test a point (usually (0, 0)) to see if it satisfies the inequality.
- 😀 If the test point satisfies the inequality, shade the region where the point lies. If it doesn't, shade the opposite region.
- 😀 In the example of 'x + y ≥ 2', the solution region is above the line, and the region is shaded above the line.
- 😀 In the example of '2x + 3y ≤ 6', the solution region is below the line, and the region is shaded below the line.
- 😀 Practice with more examples will help improve the understanding and application of linear inequalities in two variables.
Q & A
What is a linear inequality in two variables?
-A linear inequality in two variables is an inequality that involves two variables, each with a degree of 1. The general form is ax + by (inequality sign) c, where a, b, and c are real numbers, and a and b are not equal to zero.
What are the four common inequality signs used in linear inequalities?
-The four common inequality signs used in linear inequalities are: ≥ (greater than or equal to), > (greater than), ≤ (less than or equal to), and < (less than).
What does the line represent in the solution of a linear inequality?
-The line represents the boundary where the inequality becomes an equality. The region above or below the line (depending on the inequality) indicates the solution set.
How do you determine whether to use a solid or dashed line when graphing a linear inequality?
-If the inequality sign is ≥ or ≤, a solid line is used because the points on the line are included in the solution. If the inequality sign is > or <, a dashed line is used because the points on the line are not included.
In the example x + y ≥ 2, how do we find the intercepts?
-To find the intercepts for x + y ≥ 2, first convert it to equality: x + y = 2. Then, for the x-intercept, set y = 0 and solve for x, giving the point (2, 0). For the y-intercept, set x = 0 and solve for y, giving the point (0, 2).
What is the purpose of testing a point like (0, 0) when solving a linear inequality?
-Testing a point like (0, 0) helps determine which side of the line represents the solution region. If the point satisfies the inequality, the region that includes that point is shaded; otherwise, the other side is shaded.
In the example 2x + 3y ≤ 6, how do we find the solution region?
-First, convert the inequality to an equation: 2x + 3y = 6. Then, find the intercepts by setting x = 0 and y = 0. Plot the intercepts, draw the line, and test the point (0, 0) to determine which side of the line to shade. Since (0, 0) satisfies the inequality, the region below the line is the solution.
What is the meaning of the term 'solution set' in the context of linear inequalities?
-The solution set of a linear inequality is the region of the Cartesian plane that satisfies the inequality. It consists of all the points that make the inequality true, which are typically shaded on the graph.
How do you handle the case when the inequality sign is strict (>, <)?
-When the inequality sign is strict (>, <), you use a dashed line to represent the boundary because points on the line are not part of the solution set.
Why is the test point (0, 0) often chosen in solving linear inequalities?
-The test point (0, 0) is often chosen because it is easy to substitute into the inequality. It is also the point of intersection between the x and y axes, making it a convenient reference for determining which side of the line is the solution region.
Outlines

Esta sección está disponible solo para usuarios con suscripción. Por favor, mejora tu plan para acceder a esta parte.
Mejorar ahoraMindmap

Esta sección está disponible solo para usuarios con suscripción. Por favor, mejora tu plan para acceder a esta parte.
Mejorar ahoraKeywords

Esta sección está disponible solo para usuarios con suscripción. Por favor, mejora tu plan para acceder a esta parte.
Mejorar ahoraHighlights

Esta sección está disponible solo para usuarios con suscripción. Por favor, mejora tu plan para acceder a esta parte.
Mejorar ahoraTranscripts

Esta sección está disponible solo para usuarios con suscripción. Por favor, mejora tu plan para acceder a esta parte.
Mejorar ahoraVer Más Videos Relacionados
PERTIDAKSAMAAN LINEAR DUA VARIABEL
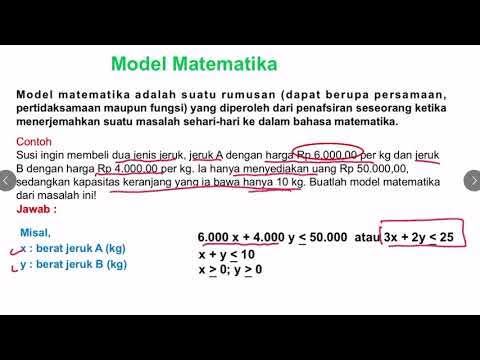
MENENTUKAN MODEL MATEMATIKA DARI SOAL CERITA SPtLDV

ILLUSTRATING LINEAR INEQUALITIES IN TWO VARIABLES || GRADE 8 MATHEMATICS Q2
SPtDV Matematika Kelas 10 • Part 1: Pertidaksamaan Linear & Kuadrat Dua Variabel
Materi:Himpunan Penyelesaian Sistem Pertidaksamaan Linear (Dua) Variabel" (SPTLDV) Kelompok-1
memahami konsep persamaan linear satu variabel
5.0 / 5 (0 votes)
