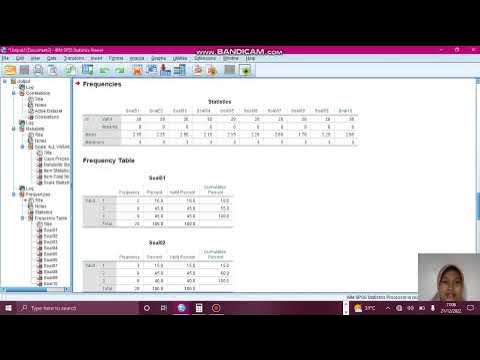
Cara Uji Validitas dan Reliabilitas dengan SPSS FULL
Summary
TLDRThis tutorial demonstrates how to test the validity and reliability of data using SPSS. It covers two methods for testing validity—R value comparison and significance testing (p-value under 0.05). The tutorial then explains how to check reliability using Cronbach Alpha, with a value above 0.6 being considered reliable. Using sample variables X1, X2, and Y, the video guides viewers step-by-step on how to interpret the SPSS output for both tests, ensuring data is valid and reliable for further analysis.
Takeaways
- 😀 The validity test in SPSS can be performed by checking if R count is greater than the table value, or by checking if the significance value is smaller than 0.05.
- 😀 If R count is smaller than the table value, or if the significance value is greater than 0.05, the data is considered invalid.
- 😀 A sample data set of 50 with three variables (X1, X2, and Y) is used for the validity and reliability tests in SPSS.
- 😀 The correlation between variables is tested using bivariate correlation analysis to determine the validity of each indicator.
- 😀 The R table value for a sample size of 50 is 0.2787. Any R value above this threshold indicates validity.
- 😀 Significance values for each variable must be below 0.05 for the indicators to be considered valid.
- 😀 After confirming validity, a reliability test using Cronbach's Alpha is conducted.
- 😀 A Cronbach's Alpha value greater than 0.6 indicates that a variable is reliable.
- 😀 SPSS allows for the calculation of Cronbach’s Alpha by selecting the relevant variables for each test and analyzing the output.
- 😀 Variables X1, X2, and Y in this tutorial are all shown to be valid and reliable based on the tests performed.
- 😀 The tutorial concludes by showing how simple it is to test validity and reliability using SPSS, encouraging viewers to apply these methods in their own data analysis.
Q & A
What is the first step in testing validity in SPSS?
-The first step in testing validity is to compare the R count with the R table value. If the R count is greater than the R table value, the indicator is valid. If it's smaller, the indicator is not valid.
How do you determine validity using significance values?
-You check the significance value. If it is smaller than 0.05, the indicator is valid. If it is greater than 0.05, the indicator is not valid.
What formula is used to find the R table value in validity testing?
-The R table value is calculated using the formula √(n - 2), where 'n' is the sample size. For example, if the sample size is 50, then R table = √(50 - 2) = 0.2787.
How can you check the validity of variable X1 in SPSS?
-To check the validity of variable X1 in SPSS, you calculate the R value from the bivariate correlation. If the R count is greater than the R table value (0.2787), and the significance value is below 0.05, then X1 is valid.
What does it mean if the R count is smaller than the R table value?
-If the R count is smaller than the R table value, it means that the indicator for that variable is not valid.
What is Cronbach's Alpha used for in reliability testing?
-Cronbach's Alpha is used to measure the internal consistency of a set of indicators. If the value is greater than 0.6, the variable is considered reliable.
What is the threshold for Cronbach's Alpha to determine reliability?
-The threshold for determining reliability is a Cronbach's Alpha value greater than 0.6. If it's higher than 0.6, the variable is considered reliable.
How do you calculate Cronbach's Alpha in SPSS?
-In SPSS, you perform a reliability analysis by selecting 'Analyze' > 'Scale' > 'Reliability Analysis'. Then, you select the relevant variables and click 'OK'. SPSS will output the Cronbach's Alpha value.
What does a Cronbach's Alpha value of 0.89 indicate for variable X1?
-A Cronbach's Alpha value of 0.89 for variable X1 indicates that it is reliable, as it is greater than the 0.6 threshold for reliability.
What steps should be taken after confirming the validity and reliability of a variable?
-After confirming the validity (by checking R count and significance) and reliability (by checking Cronbach's Alpha), you can conclude that the variables are appropriate for further analysis.
Outlines

Esta sección está disponible solo para usuarios con suscripción. Por favor, mejora tu plan para acceder a esta parte.
Mejorar ahoraMindmap

Esta sección está disponible solo para usuarios con suscripción. Por favor, mejora tu plan para acceder a esta parte.
Mejorar ahoraKeywords

Esta sección está disponible solo para usuarios con suscripción. Por favor, mejora tu plan para acceder a esta parte.
Mejorar ahoraHighlights

Esta sección está disponible solo para usuarios con suscripción. Por favor, mejora tu plan para acceder a esta parte.
Mejorar ahoraTranscripts

Esta sección está disponible solo para usuarios con suscripción. Por favor, mejora tu plan para acceder a esta parte.
Mejorar ahoraVer Más Videos Relacionados

Dongeng tentang uji validitas Cara uji validitas spss 23, cara baca output

validitas, reliabilitas, tingkat kesukaran dan daya pembeda menggunakan aplikasi SPSS 26.

Menentukan Nilai Validitas dan Reliabilitas Soal Pilihan Ganda Menggunakan SPSS

UJI VALIDITAS, RELIABILITAS, TINGKAT KESUKARAN DAN DAYA PEMBEDA SOAL TIPE URAIAN

CARA MENGUJI VALIDITAS DAN RELIABILITAS SEBUAH DATA

Cara Uji Validitas Pearson Product Moment dan Uji Reliabilitas Cronbach Alpha Dengan SPSS Lengkap
5.0 / 5 (0 votes)
