Teknik Scalping M5, Konfirmasi Entri Support & Resistance || Strategi Supply Demand di Area SNR
Summary
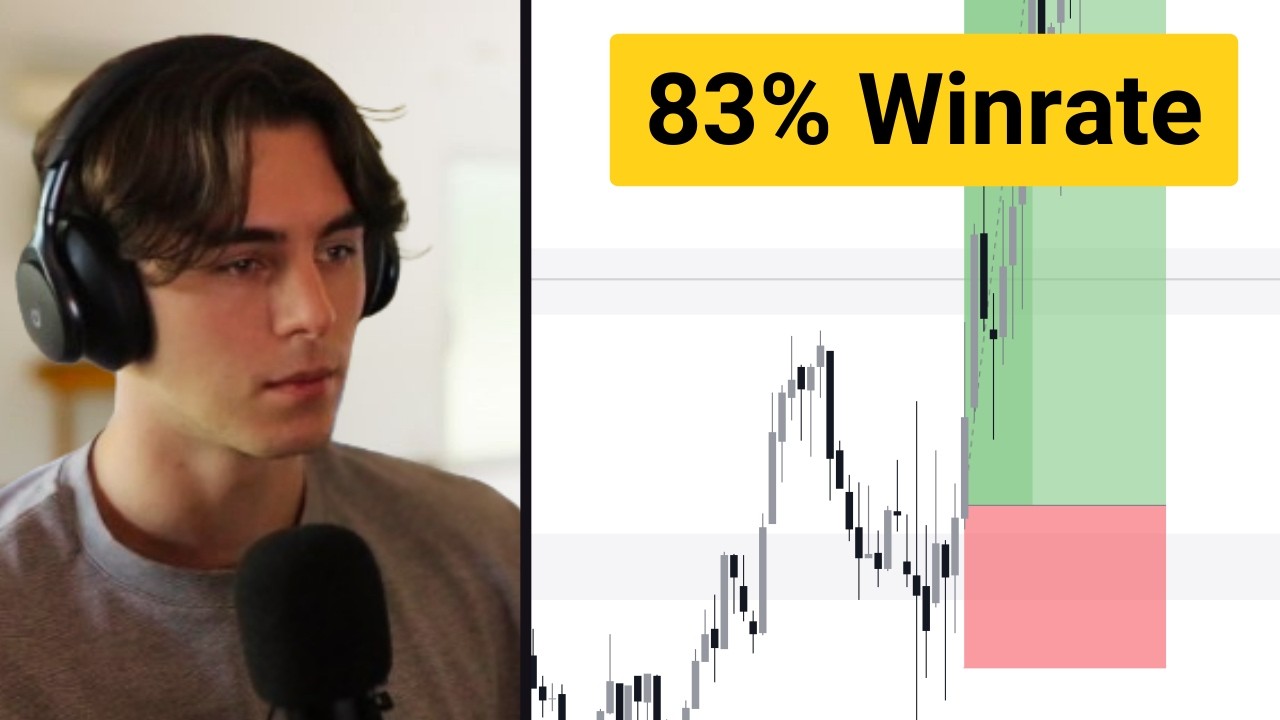
TLDRIn this video, the speaker outlines a high-win-rate trading strategy using support and resistance areas, focusing on the concept of 'Q level.' By analyzing supply and demand dynamics, the strategy helps retail traders identify key price levels and avoid false signals. The speaker emphasizes using two timeframes—larger ones for marking support/resistance and smaller ones for confirmation. Trend direction, risk management, and practical entry/exit rules are also discussed, with real-life examples showcasing how to apply the strategy for profitable trades. Traders are advised to backtest and refine the method for better results.
Takeaways
- 😀 Support and Resistance levels are referred to as 'Q level' due to the significant demand and supply areas they represent in the market.
- 😀 Price bounces or breaks through support and resistance areas based on large demand or supply volumes; a break requires strong market forces.
- 😀 As retail traders, it's crucial not to enter trades simply because the price touches a support or resistance area; confirmation from market momentum is essential.
- 😀 Use two time frames to confirm support and resistance areas: a higher time frame (e.g., H1) to mark the area and a lower time frame (e.g., M5) for entry confirmation.
- 😀 The strategy includes setting alarms at identified support/resistance levels to avoid constantly monitoring the charts.
- 😀 Confirmation candles, such as engulfing patterns, help determine whether to enter a trade when price reaches a support or resistance area.
- 😀 To avoid fake support and resistance areas, wait for strong confirmation, like a confirmed breakout or momentum shift, before entering trades.
- 😀 The ATR indicator is used to calculate stop-loss levels, ensuring they are positioned correctly based on price volatility.
- 😀 A common rule is to set take profit targets at twice the stop-loss distance to ensure favorable risk-to-reward ratios.
- 😀 Trend-following strategies involve using the 50-period and 200-period moving averages (MA50 and MA200) to determine the market direction before entering trades.
- 😀 In trending markets, only trade in the direction of the trend; in an uptrend, buy at support, and in a downtrend, sell at resistance, with confirmation from lower time frames.
Q & A
Why are support and resistance areas also called Q levels?
-Support and resistance areas are referred to as Q levels because they represent key price zones where large market participants (like institutions) enter, influencing significant price reversals or breakouts. These levels indicate areas of high demand (support) or supply (resistance).
How do retail traders take advantage of support and resistance areas effectively?
-Retail traders can take advantage of support and resistance areas by confirming entry signals on a smaller timeframe after identifying key levels on a larger timeframe. This involves waiting for momentum, such as engulfing candlesticks, and using indicators like ATR for stop-loss placement to increase trade accuracy.
Why doesn't price always bounce off support and resistance levels?
-Price doesn't always bounce off support and resistance levels because market conditions can change, causing a breakout. If there is a significant shift in supply and demand, the price may break through these levels rather than reversing.
What is the role of confirmation patterns like engulfing candles in this strategy?
-Confirmation patterns like engulfing candles help to validate the strength of a reversal or continuation at support or resistance levels. They show that the market participants are actively entering the market, which increases the probability of a successful trade.
How do traders avoid being fooled by fake support and resistance areas?
-To avoid fake support and resistance areas, traders should wait for additional confirmation signals such as candlestick patterns or momentum indicators before entering trades. Simply reacting when the price touches a level can lead to false breakouts.
What is the importance of using multiple timeframes in this strategy?
-Using multiple timeframes allows traders to first identify key support and resistance levels on a higher timeframe (e.g., H1 or H4) and then confirm trade entries on a smaller timeframe (e.g., M5). This increases the accuracy of trade decisions.
How do moving averages (MA50 and MA200) help traders in this strategy?
-Moving averages, such as MA50 and MA200, help traders determine the overall market trend. If MA50 is above MA200, it indicates an uptrend, prompting traders to focus on buying at support. Conversely, if MA50 is below MA200, it signals a downtrend, and traders should focus on selling at resistance.
How does the ATR (Average True Range) indicator assist with stop loss placement?
-The ATR indicator helps traders set stop losses by measuring market volatility. Traders can add the ATR value to the swing high (for sell positions) or subtract it from the swing low (for buy positions) to determine an appropriate stop loss distance, considering market conditions.
Why is it important to pay attention to the 'profit zone' in trading?
-The 'profit zone' refers to the area between the entry point and the target, such as the swing high or low. Paying attention to this zone ensures that trades have a favorable risk/reward ratio. If the price targets are set too far, the trade becomes riskier, potentially leading to losses.
What are some common pitfalls that traders should avoid when using this strategy?
-Traders should avoid entering trades when candlestick patterns are too large or abnormal, as this can result in poor risk/reward ratios. Additionally, they should not rely solely on one signal but should wait for confirmation from other indicators to increase the probability of success.
Outlines

Esta sección está disponible solo para usuarios con suscripción. Por favor, mejora tu plan para acceder a esta parte.
Mejorar ahoraMindmap

Esta sección está disponible solo para usuarios con suscripción. Por favor, mejora tu plan para acceder a esta parte.
Mejorar ahoraKeywords

Esta sección está disponible solo para usuarios con suscripción. Por favor, mejora tu plan para acceder a esta parte.
Mejorar ahoraHighlights

Esta sección está disponible solo para usuarios con suscripción. Por favor, mejora tu plan para acceder a esta parte.
Mejorar ahoraTranscripts

Esta sección está disponible solo para usuarios con suscripción. Por favor, mejora tu plan para acceder a esta parte.
Mejorar ahoraVer Más Videos Relacionados

BEST MACD Trading Strategy [86% Win Rate]

勝率の高いトレード手法教えます【再現性高】

Simple 1 Minute Scalping Strategy To Make $300/Day (Backtesting REAL Results)

How I trade London Session (84% WR Strategy)

Testing $20 To $52,400 Strategy 1000 TIMES - Fastest Way To Grow Small Trading Account
Trading with $10 to Prove it's Not Luck...
5.0 / 5 (0 votes)
