勝率の高いトレード手法教えます【再現性高】

FXコミュニティYTC
18 Apr 202220:27

Summary

TLDRThe video script discusses a reliable trading method that focuses on trend following and Elliott wave theory, particularly the third wave, to achieve high win rates in trades. The speaker emphasizes the importance of identifying the high and low points of the previous candlestick, confirming support and resistance levels, and ensuring the clarity of recent highs for better reproducibility of the trading method. The video outlines three key points to increase the success rate: confirming support and resistance, examining the manner of high updates and subsequent pullbacks, and considering the trend direction of higher timeframes. Two cautionary notes are also highlighted—being mindful of the time frame for trading and setting appropriate stop-losses. The speaker suggests using tools like Fibonacci retracements and indicators that measure limit amplitudes to refine entry and exit points. The summary underscores the significance of combining trading techniques with environmental awareness, scenario analysis, and mental control for sustainable profitability in trading.

Takeaways

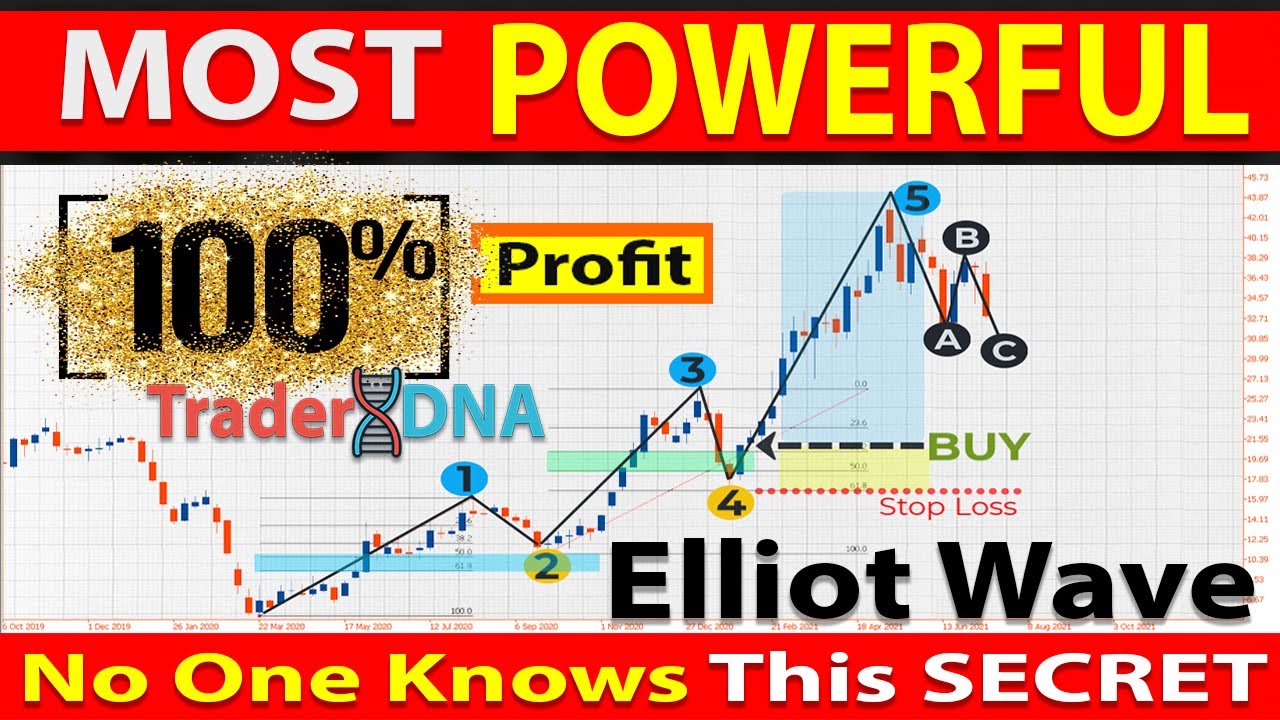
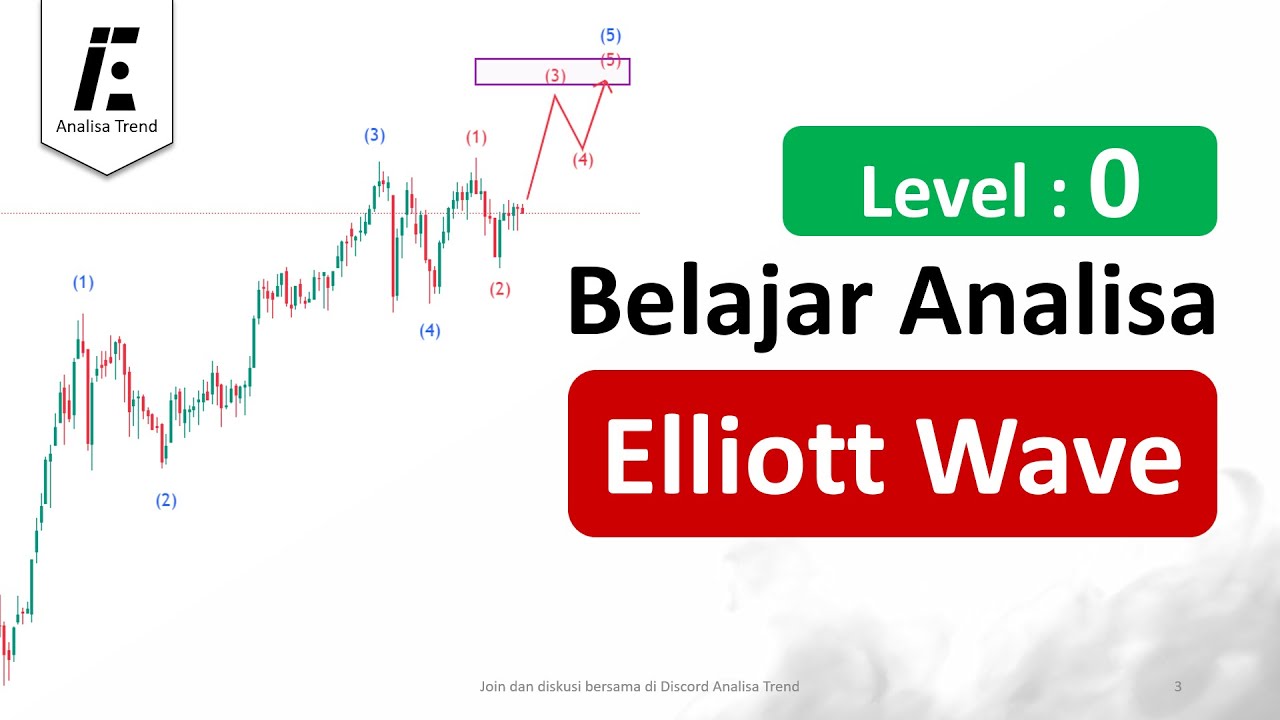
  • 📈 Focus on trend following and Elliott Wave Theory, specifically targeting the third wave for higher win rates in trades.
  • 🔍 Identify key support and resistance levels by confirming the latest high and low of the previous candlestick, ensuring a clear reference point for trade entries.
  • 🚫 Avoid entering trades immediately upon reaching new highs as it may lead to a lack of support and potential losses.
  • 📊 Emphasize the importance of past chart analysis to understand the success rate of the trading method and to identify optimal entry points.
  • 🟢 Look for chart patterns such as Head and Shoulders or Double Bottom before entering a long position, as these can signal a potential reversal.
  • 🔺 Pay attention to price action and trend transitions, such as moving averages turning upwards, to increase the likelihood of a successful trade.
  • ⏰ Consider the time frame of trades, as certain market sessions may offer better opportunities for the trading method to be effective.
  • 🔼 Monitor the direction of the higher time frame trend to align with the trading method for increased chances of success.
  • 📌 Use indicators like Fibonacci retracements or limit order volume to determine potential entry and exit points in a trade.
  • ✂️ Implement strict risk management by setting stop-loss orders at appropriate support levels to mitigate potential losses.
  • 💡 Recognize that a combination of trade technique, environmental awareness, scenario understanding, and mental control is essential for consistent profitability in trading.

Q & A

  • What is the main trading method introduced in the video?

    -The main trading method introduced is a trend following strategy that focuses on Elliott Wave Theory, specifically capturing the third wave for a high win rate trade. It involves confirming the previous high, checking for a new high, and then looking for a pullback to the previous high before considering a trade.

  • What are the three key points to consider when using this trading method?

    -The three key points are: 1) Confirming the previous high and the pullback to it, 2) Ensuring there is support or resistance at play, and 3) Observing the trend direction on higher time frames.

  • Why is it important to identify the previous high accurately?

    -Identifying the previous high accurately is crucial for the reproducibility of the trading method. If the high is not clearly defined, the method's effectiveness and reliability decrease.

  • What is the significance of observing the pullback after a new high is reached?

    -Observing the pullback is important because it helps to confirm if the market has found support or resistance at the previous high level, which is a key factor in determining the potential for a successful trade.

  • How does the speaker suggest improving the success rate of the trading method?

    -The speaker suggests improving the success rate by thoroughly confirming support and resistance levels, looking at how the new high was reached and the nature of the pullback, and considering the trend direction on higher time frames.

  • What is the role of past chart analysis in this trading method?

    -Past chart analysis is used to validate the trading method by observing historical price action and identifying patterns that led to successful trades. It helps to understand under what conditions the method is more likely to be successful.

  • Why is it advised not to enter a trade immediately after the price returns to the previous high?

    -Entering a trade immediately after the price returns to the previous high can be risky because it may not have found sufficient support or resistance. It's better to wait for confirmation of support or resistance before entering a trade.

  • What are the two additional points of caution mentioned in the video?

    -The two additional points of caution are related to the time of trading and the management of trades. It's important to consider the market's time zone and typical patterns during different times of the day, and to manage trades with clear exit strategies, such as using stop-loss orders.

  • How does the speaker suggest managing the risk in trades?

    -The speaker suggests using stop-loss orders to manage risk, placing them below the previous low in a bullish scenario or above the previous high in a bearish scenario. Additionally, the use of indicators like Fibonacci retracements and limit order volumes can help in managing exits.

  • What is the significance of the 'limit order volume' indicator mentioned by the speaker?

    -The 'limit order volume' indicator helps to predict the day's potential high and low prices by showing the volume of limit orders at different price levels. This can assist traders in making more informed decisions about entry and exit points.

  • Why does the speaker emphasize the importance of not relying solely on trading methods for consistent profitability?

    -The speaker emphasizes that while trading methods are important, they should be combined with other skills such as environmental awareness, scenario analysis, and mental control for consistent profitability. No single method can guarantee success in trading.

  • What additional resources does the speaker offer to help traders improve their skills?

    -The speaker offers a community (fx コミュニティ) and an indicator (簿ライン) that automatically displays the limit order volume, which can help traders identify potential support and resistance levels and manage their trades more effectively.

Outlines

00:00

📈 Introduction to a High-Success-Rate Trading Method

The speaker introduces a personal favorite trading method that follows trends and utilizes Elliott Wave theory to identify high-probability trades. The method focuses on confirming the previous high, ensuring the recent high is surpassed, and looking for a pullback to the previous high as a signal to buy. The video's outline includes an explanation of the method, three key points to consider, and two cautionary notes. The importance of using the high of the previous candlestick as a reference for consistency and reproducibility is emphasized.

05:03

📉 The Importance of Support and Resistance in Trading

The paragraph discusses the significance of support and resistance levels in determining the success of a trade. It advises against entering a trade as soon as the price returns to the previous high without confirming support. The speaker suggests waiting for a clear trend change, signaled by a shift from a downtrend to an uptrend, before entering a long position. Chart patterns like head and shoulders or double bottom, as well as price action cues like engulfing lines, are important to recognize before making a trade. The paragraph also touches on the concept of limit order volume and how it can be used to predict the day's high and low prices.

10:06

⏳ Timeframes and Trade Execution Considerations

This section highlights the impact of timeframes on the success of a trade. It points out that updating new highs during the Tokyo market in the morning may not be sustained, and it may be more effective to wait for another market session to confirm the high before entering a trade. The speaker also discusses the concept of limit order volume, suggesting that understanding the typical range for a specific timeframe can help avoid overtrading. Additionally, the importance of setting stop-losses at support levels and using tools like Fibonacci retracements or the concept of limit order volume for profit taking is covered.

15:08

🚫 Cautionary Notes on Trade Execution

The speaker offers two cautionary notes for executing trades. The first is about the importance of time of day, suggesting that it may be more effective to trade during the European session rather than the Tokyo morning session. The second cautionary note is about setting stop-losses and taking profits. The speaker recommends setting stop-losses at the low of the previous candlestick and using various tools to determine profit-taking opportunities. The paragraph concludes by emphasizing that a combination of trade methods, environmental awareness, scenario planning, and mental control is necessary for consistent profitability in trading.

20:11

🎬 Conclusion and Additional Resources

The speaker concludes by reiterating that relying solely on trade methods is not sufficient for continuous profitability in trading. They encourage viewers to consider environmental awareness, scenario planning, and mental control, in addition to trade methods. They also promote their FX community and provide a link for viewers to learn more about the limit order volume indicator tool that they offer, which helps in executing trades without overstretching.

Mindmap

Keywords

💡Trend Following

Trend following is a trading strategy that involves buying or selling in the direction of the current price trend. In the video, the speaker discusses how this method can be effective when combined with Elliott Wave Theory, particularly focusing on the third wave for higher win rates.

💡Elliott Wave Theory

Elliott Wave Theory is a technical analysis method that suggests market prices move in repeating cycles. The video references this theory to explain how to identify the third wave for trading opportunities, which is considered a key part of the presented strategy.

💡Support and Resistance

Support and resistance are levels on a price chart where the price tends to stop and reverse. In the context of the video, the speaker emphasizes the importance of confirming these levels before entering a trade, as they can indicate potential entry and exit points.

💡High-Low Confirmation

High-low confirmation refers to the process of verifying the previous high or low price levels. The video script mentions confirming the previous high and low prices as a way to identify potential reversal points in the market trend.

💡Price Action

Price action is the movement of an asset's price over time, without any additional indicators. The speaker in the video discusses using price action to determine whether the market is in an uptrend or downtrend, which is crucial for making trading decisions.

💡Chart Patterns

Chart patterns are graphical representations of price movements that can predict future price movements. The video script references chart patterns like head and shoulders and double bottoms, which can be used to identify entry points for trades.

💡Fibonacci Retracement

Fibonacci retracement is a method used to identify potential support and resistance levels by applying the Fibonacci sequence to an asset's price movement. The speaker mentions using this tool to help determine profit-taking levels in trades.

💡Limit Order

A limit order is an order to buy or sell a security at a specific price or better. In the video, the speaker talks about setting limit orders below the low of the previous candle as a way to manage risk and protect profits.

💡Time Frame Analysis

Time frame analysis involves looking at different time periods on a price chart to identify trends and potential trading opportunities. The video script discusses the importance of considering the time frame when analyzing high and low price updates.

💡Stop Loss

A stop loss is an order placed to sell a security when it reaches a certain price, to minimize potential loss. The speaker in the video suggests setting a stop loss below the low of the entry candle as a risk management strategy.

💡Mental Control

Mental control in trading refers to the ability to manage emotions and maintain discipline in the face of market volatility. The video concludes with a mention of mental control as an essential skill, alongside trade management and environmental awareness, for consistent profitability in trading.

Highlights

The speaker introduces a highly effective trading method based on trend following and Elliott Wave Theory, emphasizing capturing the third wave for high win rates.

The trading strategy involves confirming the previous high, ensuring the latest high is surpassed, and then looking for a pullback to the previous high as a buying opportunity.

Emphasis on the importance of identifying the exact previous high from the last candlestick's high, which is crucial for the strategy's reproducibility.

The speaker advises against entering trades immediately after a new high, as it's essential to wait for confirmation of support or resistance levels.

Highlighting the need to verify past performance through chart analysis to understand the best conditions for the strategy's success.

Three key points to increase the win rate of the trading method are presented: confirming support and resistance, observing the way new highs are made and how the pullback occurs, and checking the trend direction from higher timeframes.

The speaker warns against entering trades during an immediate pullback as it often leads to losses, a common mistake among losing traders.

Chart patterns such as Head and Shoulders or Double Bottom should be visible before considering a long position, according to the speaker.

Price action analysis, including engulfing candles and hammer candles, is crucial before entering a trade, as detailed by the speaker.

The importance of considering the trend direction from a higher timeframe, such as using moving averages or observing high and low price action, is discussed.

Two cautionary points are mentioned: the influence of market session times on the strategy's effectiveness and the importance of proper trade management including stop-loss placement.

The speaker notes that the strategy's success rate increases significantly during specific market sessions, such as the New York session.

A method for setting stop-loss based on the most recent low is suggested, along with trailing stop techniques.

The use of Fibonacci levels and range observation for profit-taking decisions is discussed, with a personal preference for range observation based on historical data.

The speaker introduces a community tool called 'Limit Line', an indicator that helps visualize the day's potential high and low, aiding in trade management.

Several examples of the trading method's application in various market scenarios are provided, illustrating both successful and unsuccessful trade setups.

The speaker concludes by stressing that no single trading method can guarantee continuous profitability; it must be combined with environmental awareness, scenario analysis, and mental control.

The importance of community and continuous learning is highlighted, with an invitation to join the speaker's FX community for further insights.

Transcripts

play00:03

2

play00:06

今日は家にです

play00:09

今回は以前ツイッターでも紹介しました

play00:12

個人的にはかなり鉄板なトレード方法を

play00:15

紹介します最初にこのトレード内容を少し

play00:18

お伝えしますとトレンドフォローができて

play00:21

エリオット波動の3波を取りやすく勝率が

play00:25

高いトレード方向になります動画の目次は

play00:28

play00:29

これで方法の解説

play00:31

調律を挙げる3つのポイント

play00:34

2つの注意点ですまず最初にこのトレード

play00:36

方法をすごく簡単に説明しますと

play00:40

前回の高安を講習したのを確認します

play00:46

宴会の高値を更新したのを確認します

play00:50

前回の坂根ですね

play00:53

更新したのを確認して

play00:56

茜更新号前回高値付近までの戻しを確認し

play01:02

ます

play01:03

あかねを行使した後戻しを確認します

play01:07

サポート

play01:08

レジスタンスされれば押し目買い戻り売り

play01:11

これだけですおいてまとめますと前回の

play01:14

高値を更新した後に前回の高音まで戻して

play01:19

サポートされれば押し目買いこれだけです

play01:23

こんなトレード方法よくある

play01:27

トレード方向ですよねレジスタンスで

play01:29

サポートに転換して

play01:32

そこが押し目になって上昇と

play01:35

もう誰もが知っている教科書的な考え方な

play01:38

んですけれども少し他のものとは違うので

play01:41

最後まで聴いてください

play01:43

では一つ一つ詳しく説明していきます前回

play01:46

っていうのが結構注目

play01:49

していただきたいんですけれども前回の誰

play01:52

かねっっていうのは一つ前のローソク足の

play01:55

高値になりますちなみに戻り売りする場合

play01:59

は安値でぱまいませんので一つ前の

play02:02

ローソク足の高値って何なんだっていう話

play02:04

なんですけど例えば

play02:06

冷やし

play02:07

1本前は日足の高値ですこの場合だとこの

play02:12

日が3月の8日になりましてその前の広3

play02:15

月7日の高値になります

play02:17

なので前日の高値になるんですよどれが

play02:21

大事ですっ適当に見つけた前回の高値では

play02:25

なくてこうやって1本前のローソク足の

play02:29

高値っていう誰でも見つけられるたかねぇ

play02:33

家のがわかりやすいポイントで

play02:36

この高安っていうのが結構どこでも見て

play02:39

しまうんですよここだったり

play02:41

ここだったり前回というのがよくわから

play02:44

ないから直近の高値とかってすごい曖昧な

play02:46

んですよ

play02:47

これを前回の高値って言う

play02:51

皆が同じところを見れる

play02:54

茜3するからこそ

play02:58

とりやすい手法になっています今は

play03:01

前日の高値で

play03:04

俺チャート見ましたけれども一つ前の

play03:06

ローソク足であれば別の時間軸でも ok

play03:09

です

play03:10

例えば

play03:13

c はし一つ前の週足の高値でも良いです

play03:16

play03:17

一つ前の4時間足の高値でも良いですし

play03:21

1時間してももちろん ok ですどの

play03:23

時間軸でもいいので1本前のローソク足の

play03:26

高安を更新した戻し

play03:30

を見てください

play03:32

この高安が明確でないと再現性はかなり

play03:37

低いです

play03:37

いろんなトレーダー見てますけど高安を

play03:40

適当なところに置いてし決めてしまって

play03:42

基準があいまいで

play03:45

再現性が低いトレードしている方っていう

play03:47

のはけっこう多いので必ず一つ前の

play03:50

ローソク足の高安を基準にするようにして

play03:53

ください

play03:54

非常に重要なポイントなのでもう1回だけ

play03:56

います

play03:57

高安が明確でないと再現性が低いので必ず

play04:02

一つ前のローソク足の高安を基準にする

play04:06

ようにしてくださいでこちらの高安を更新

play04:10

したことをまずは確認します次に前回の

play04:13

高安講師リンゴを前回高安付近まで戻す

play04:17

あるいは

play04:19

押し目を確認します

play04:21

この場合だと

play04:23

更新してから戻してますよね

play04:26

戻していますこれを確認します大きく高安

play04:31

を更新しすぎてるとこのパターンで勝ち

play04:33

にくいのでどの程度高安を抜けたら

play04:37

このちっトレード方法が成功しやすいか

play04:40

っていうのは過去のチャート見て過去検証

play04:43

した方が良いと思います例えばこの場合で

play04:46

高値ここで高値更新

play04:49

急登ですごいしたとしますこの戻しって

play04:52

いうのはそんなに聖子しにくいので

play04:56

この更新の仕方とか

play04:59

どれくらい更新した後に戻したらこの手法

play05:03

が成功しやすいのかっていうのを得過去の

play05:05

チャートずーっと見ていくとどれくらい

play05:07

更新した時は成功しやすいというのが

play05:10

分かると思って過去検証は必ずして

play05:13

ください3つ目前回高値を更新して前回

play05:17

高値まで戻ってきますますここでサポート

play05:21

されたかどうかが大事ですサポートされれ

play05:23

ばロング

play05:25

サポートされてないのにエントリーすると

play05:28

茜更新したって思ってみた人がロングで

play05:33

ついていくんですよその人たちをいったん

play05:36

刈り取ってから上昇していくっていう

play05:38

パターンもありますので刈り取るっていう

play05:40

のはロスカット損切りさせてから上昇して

play05:44

いくというパターンありますのでちゃんと

play05:46

ここでサポートされたかどうかっていう

play05:48

ところに

play05:50

ちょっと目を向けていただければなと思い

play05:52

ます

play05:53

サポートされたかどうかの判断というのは

play05:55

ちょっと難しいサポートされたかどうかの

play05:58

判断は後半でお話ししますので次にこの

play06:01

トレイの方法で勝率を上げる3つの

play06:03

ポイントなんですけれども

play06:05

まず一つ目がサポートレジスタンスを

play06:08

しっかり確認することです

play06:10

高安に戻ってきてすぐにエントリーしては

play06:13

いけません上昇してあ戻ってきたここで

play06:16

タッチでロングっていうのは絶対にやめて

play06:18

くださいこれはよく負けトレーダーに見

play06:21

られる行動なので絶対してはいけません

play06:23

戻ってきてすぐにサポートレジスタンスさ

play06:26

れているかっていうのは判断できません

play06:29

まあ品というを例えばここ下降トレンドに

play06:31

なってますね会や市では上昇して戻す時と

play06:35

いうのは必ず下降トレンドになっています

play06:37

格好トレンドから上昇トレンドに変わる

play06:41

シーンがあるんですよこのを占めになるの

play06:44

であれば

play06:46

ダウ理論です米ダウ理論が転換して上昇し

play06:50

ていくんですこの会や市でのトレンドの

play06:53

転換したなっていうをし安値

play06:57

戻り高値が戻り高値切り上げ安値切り上げ

play07:00

高値更新安値切り上げしていけば long

play07:03

です

play07:04

それを確認してからロングでいいですか

play07:07

こうしている時にロングはしなくていいん

play07:09

です前回の高値付近でチャートパターン客

play07:12

さん村ヘッドアンドショルダーとか

play07:15

ダブルボトムが見られてから後はチャート

play07:18

パターンのトレード方法ですよね

play07:20

ネックライン抜けてからの戻しでロング

play07:23

するとかいろいろありますよね

play07:25

そういうのを使って

play07:27

チャートパターンが確認できてからロング

play07:29

するチャートパターンが行きもしないよう

play07:33

に入らない

play07:34

またプライスアクションですよね

play07:36

つつみ足とか

play07:37

はらみ足とか

play07:39

インバートか

play07:40

園ゴルフ品バード色々ありますけど

play07:43

そういうのが確認できてからここで

play07:46

long です

play07:47

何も出てないのに下がってる途中でロン

play07:50

グっていうのが一番負けやすいパターンな

play07:52

ので

play07:54

そういう時っていうのはあっと行かれて

play07:57

天田村リーダーでず鉄板じゃないってなり

play07:59

ますので必ずプライスアクションチャート

play08:03

パターントレンドの転換

play08:05

移動平均線が上向きになったとか

play08:08

グランビルの法則で離れていきそういうの

play08:10

を確認してから入ってくださいこれはまあ

play08:13

この種方に限らず結構大事なことなので

play08:16

このサポートされるかレジスタンスされる

play08:18

かみたいなところは見た方がいいと思い

play08:20

ます

play08:21

すぐにサポートレジスタンスされているか

play08:24

判断できるようにはならないと思うんです

play08:26

play08:26

なので毎回自分が押し目戻り目になる

play08:30

ポイントになると毎回注意してチャート見

play08:33

たりいい過去チャートで押し目となる部分

play08:36

play08:37

会や市でどんな系形成をしていたかとか

play08:40

いうのもちゃんと見てみると

play08:43

実際にそうやってサポートとレジスタンス

play08:45

されたかどうかての判断できるようになる

play08:47

と思いますぜひ勝率を上げる2つ目の

play08:51

ポイントなんですけれども高安の更新の

play08:53

仕方と更新してからの戻し方を見ます

play08:57

急騰急落で高安を更新していってその後

play09:01

急激に戻してくる場合というのはこの

play09:03

トレード方法では勝ちにくくなります

play09:06

例えば

play09:07

これ結構急騰で上昇高安更新していったん

play09:11

ですけどその後も旧戻しの場合は結構そこ

play09:15

が押し目になりにくい買ったりします

play09:18

この抜け方高音の抜け方とこの前回高値

play09:24

までの戻し方ですね

play09:26

どうやってうわ抜けてどうやって戻してき

play09:30

たかというところを見てください

play09:33

ここが

play09:35

急騰急落だったり急上昇でだいぶ9うわ

play09:40

ねっ

play09:41

を急上昇したこの高値をだいぶ校

play09:45

重たそうにしてからの加工だった場合は

play09:48

やっぱり高値更新していきにくいのでここ

play09:52

で押し目やばなりにくいですねもしここで

play09:55

サポートされたとしてもやっぱここで

play09:57

レジスタンスされてまた違っていくみたい

play10:00

なこともあるので

play10:01

この向け方抜け戻し方に注意してください

play10:05

これも過去検証してどんなときに失敗し

play10:09

やすいのかもちろん上癒しの方向感って

play10:11

いうのは当たり前に見てほしいんですけど

play10:14

両足が上向きであればこのトレード方法は

play10:16

もちろん成功しやすいですトレンドが上な

play10:19

わけですから高値更新して教え夢で勝って

play10:22

いく

play10:23

でこういうところが押し目になりやすいん

play10:24

ですよね

play10:26

8癒しの方向感ただ細かいことを言うと

play10:29

あかねの更新の仕方更新してからのを占め

play10:33

の戻し方であとはサポートされたかどうか

play10:38

3つ目が上位足のトレンド方向を見て

play10:42

くださいトレンド方向の確認の仕方って

play10:44

いうのは

play10:46

例えば移動平均線が上向きとか

play10:50

赤安安値切り上げ高値更新してば上昇取る

play10:53

のですよねジョー癒しのと蓮の方向を確認

play10:57

して後は

play11:00

上昇

play11:01

戻し方サポートの仕方この3つを見れば

play11:04

勝率っていうのはだいぶ高くなります最後

play11:06

に2つの注意点なんですけれども時間帯と

play11:09

決済です

play11:11

一つ目時間帯ですけれども午前中の東京

play11:14

市場で高安を更新したとしてもその後勢い

play11:18

が続かないことというのは多いです往診し

play11:21

たとしても結構ここの勢い続かないことが

play11:24

多いのでその後小時間をかけてから別の

play11:29

市場で高値更新って言うことが多いので

play11:33

どのマーケットかなのか今がその

play11:37

マーケット12個の高値を更新できないの

play11:40

であれば次のマーケット始まってから

play11:42

ちゃんとを占めになって高値更新していき

play11:46

そうなら入っていくっていう感じで時間帯

play11:49

を見ると

play11:50

え故障率高くなります

play11:53

16時以降の輪舞曲

play11:56

のマーケットの時にこのトレード方法って

play11:58

いうのは結構

play12:01

they えい航しやすくなっています

play12:04

ロンドンでさほど動かないきっていうのも

play12:07

もちろんあるんですよその時は

play12:08

ニューヨークに逆に決まりやすくなります

play12:11

各まあゲットでどんな動きになったかでも

play12:15

このパターンが成功しやすいかの判断でき

play12:18

ますので箱検証する際は時間帯っていう

play12:22

ところにも注目してみてくださ安を更新

play12:25

する時間を意識するようになるので時間帯

play12:28

のパターンっていうのも認識でき

play12:30

るっていうのがこのトレード方法の

play12:33

メリットになります冊目は決済の1です

play12:36

損切りは押し目や戻り見終わったところで

play12:39

いいと思います例えばこの場合だったら

play12:42

ここでサポートを確認してからこの付近

play12:45

からロング入れますのでこの安値を下抜け

play12:49

たところでいいと思います

play12:51

もしくはその前の安値ですね広く取りたい

play12:54

人はここ

play12:55

あるいは上昇しってここでロングします

play12:59

最初ここに入れますけど上昇してこの高値

play13:02

を更新していったら

play13:04

こっちの安値の下にコートレールして損

play13:08

義理チョずらすっていうのも

play13:11

俺の方法の一つです

play13:13

利食いはフィボナッチや

play13:15

ヘ幅観測

play13:17

横軸を意識した限界運動量っていうのを私

play13:21

は見てます

play13:22

他には上癒しのサポートレジスタンスでも

play13:25

いいと思います

play13:26

フィボナッチで値幅観測っていうのは若干

play13:29

ロジックがありますので個人的にオススが

play13:32

限界運動量です

play13:34

前回運動量っていうのは

play13:37

過去の値幅の平均値に値幅が治りやすいと

play13:41

いう考え方では詳しくはこの動画で説明し

play13:44

てるんですけど例えば

play13:45

4時間足1本っていうのはだいたいの大き

play13:48

さが決まってるんです実は

play13:51

1本の弧の長さというのはほとんど決まっ

play13:54

てるんですよ

play13:55

もちろん

play13:57

時間帯によって違うので

play13:59

その時間帯にあった大きさっていうのが

play14:01

あるんです

play14:03

そこでリング

play14:04

音ができれば

play14:06

無理して言葉を取る必要がないですよね

play14:09

限界分同僚

play14:12

いうロジックを個人的にオススメしてい

play14:15

まして

play14:16

で私が運営している fx コミュニティ

play14:18

ytc ではこの限界運動量を自動で表示

play14:23

してくれるインジケーターを提供してい

play14:26

ます簿ラインというインジケーターなん

play14:28

ですけれどもこれを使うことで伸ばしすぎ

play14:31

ない取引がしやすくなります現在無料

play14:35

プレゼント企画おこうなっていましてぼ

play14:37

ライン日足のボラ印ですね

play14:40

1日の限界値が表示してくれる

play14:44

インジケーターでその日の上限下限って

play14:47

いうのがある程度予測可能になります無料

play14:50

で全員にプレゼントしてますので概要欄

play14:52

から確認してみてください最後に今回この

play14:56

上昇のポイントを見ていきましたので他の

play14:59

場面でもの男で成功しているか見ていき

play15:02

ます例えば

play15:03

この場合前日の安値ですよねで次の日安値

play15:08

行使した後戻ってきてますけどそのままは

play15:12

うはないと言ってますよ

play15:14

ちゃんとここでレジスタンスを確認して

play15:16

からじゃないとダメなんですここで

play15:18

レジスタンスが確認された場合というのは

play15:22

オーナーありますよね急落で抜けてすぐ

play15:24

戻ってきてますのでやっぱりこれも成功し

play15:27

にくいんじゃないかなと思います移動平均

play15:29

線もちょっと1本表示してみましょうか相

play15:32

次ぎここですね

play15:35

前回の安値を下抜けてからの戻しちょっと

play15:40

成功しているっぽいですけどじゃあ

play15:42

ちょっと見てみましょうか

play15:44

前回の高値です

play15:46

連日の高値を

play15:48

次の日パッカー猫を新してから一旦戻って

play15:52

きています

play15:53

海のプライスアクションが出てますよね

play15:56

つつみ足

play15:57

これを確認してからロングで取れると

play16:01

こういうのが鉄板パターンです

play16:04

これもそうですね前回の高値を上塗り桁

play16:08

戻し

play16:09

サポート確認で安値切り上げ高値更新で

play16:15

long です

play16:17

この場合は失敗ですね

play16:20

前回高値を更新してさっきの場合ってた

play16:24

パターンですこれ

play16:25

上値がかなり重たい123し5時間ここで

play16:29

レジスタンスされてそこから売りの

play16:31

プライスアクションがここで出るんですよ

play16:35

サポート一切されずに急落なのでまぁこう

play16:39

いうところですよねまず上昇の仕方は割と

play16:43

良かったでも上値が重たかった

play16:47

結構何時間も見あってそこから

play16:50

もどって来るとき売りのプライス

play16:51

アクションが出ているので勢いが強い

play16:55

っていうこととサポートされてないので

play16:57

農園ドリーです

play17:03

前日のタッカー音を更新した後若干これ下

play17:07

抜けてるのでちょっと嫌ですね

play17:10

下抜けて様子見てたらああはまた裏抜けて

play17:14

きたのでぽいのも入ってもいいと思います

play17:17

こういうパターンもあります前日の高値を

play17:19

更新した後

play17:22

しばらくしてから後戻ってきてあっちはし

play17:25

てないんですけど

play17:27

安全に戻ってきてはないんですけど

play17:30

意識される価格ですので前回の高値って

play17:33

いうのが

play17:35

1日も値ですね1日も与えてます前々回の

play17:38

ローソク足の高値になります

play17:41

防止した後次の次の日に戻ってきてからの

play17:46

押し目買いっていうパターンもあります

play17:49

前回の安値ですね展開の安値更新を

play17:53

いったん戻ってくるけどさレジスタンスさ

play17:57

れて売りのプライスアクションでてますよ

play17:59

play17:59

ここからショートです

play18:02

こんな感じですちょっと時間軸も交えて見

play18:05

てみましょうか

play18:06

これどうですかね

play18:08

先週の高値

play18:11

を更新した後に

play18:14

戻ってきた

play18:15

で次の週ですねまた情緒サポート市に3回

play18:20

サポートされて上昇して言ってますよね

play18:23

先週の安値を更新した後に戻して若干こう

play18:29

抜けてますけど抜けた時はもう無視です海

play18:33

のアクションがここで出てますから

play18:35

しばらく無視で

play18:37

レジスタンスなんかされたなと

play18:40

この付近この価格帯でなんかこのあたりも

play18:42

なんか何度も意識されてますよね家にさん

play18:46

play18:46

この価格帯で見てでここでつつみ足が下に

play18:50

出てますのでここから

play18:52

照度ですこれ確認できるまでは

play18:55

触らなくていいんですこれも失敗パターン

play18:57

ですね

play18:58

練習のパッカー音を更新した急騰で更新し

play19:03

てますね

play19:04

で上値がだいぶ思ったくって

play19:07

集落

play19:08

全然サポートされてないのがわかりますよ

play19:11

play19:13

戻ってきて

play19:15

結構

play19:16

この急上昇に対してを占めになるのであれ

play19:19

ば結構ここで買ってこないとを占めになら

play19:22

ないんですよ

play19:23

パターンとしてやっぱ様を見てればわかる

play19:25

んですけどでも下抜けて

play19:28

細脚になってそれを否定する陰線が出てき

play19:32

ているので

play19:34

やっぱり下がっていきますよね a こんな

play19:36

感じで鉄板パターン使ってみいただければ

play19:39

なと思います

play19:41

最後にトレード手法だけではトレードで

play19:43

利益を上げ続ける

play19:45

っていうことは不可能だと思ってます

play19:48

トレード手法環境認識シナリオ資金管理

play19:51

メンタルコントロール全てのスキルを身に

play19:54

つけることで利益を上げ続けることが可能

play19:57

となると思っていますトレード手法以外の

play20:01

こともこのチャンネルだったり

play20:02

twitter 運営している fx

play20:04

コミュニティで発信していますのでよかっ

play20:07

たらチャンネル登録お願いいたします

play20:10

コミュニティに関しては概要欄から確認し

play20:12

てくださいご視聴ありがとうございました

play20:15

失礼致します

play20:18

[音楽]

play20:20

[拍手]

play20:23

持っています

play20:24

[音楽]

Rate This

5.0 / 5 (0 votes)

Related Tags
Forex TradingElliott WavesTrend FollowingHigh Win RateSupport ResistancePrice ActionTrading StrategiesTechnical AnalysisRisk ManagementChart Patterns