Best AI TradingView Indicator in 2024 | 100% Winning Strategy 🔥

Trade Algorithm
5 Jun 202405:22

Summary

TLDRThis video introduces a machine learning-based trading strategy using the 'Multiple Logistic Regression' indicator in TradingView. It combines various indicators to predict market trends and identifies buy/sell signals. To filter false signals, the 'Andian Oscillator' is used for confirmation. The strategy is enhanced by a volume profile indicator, 'Wada ATA Explosion V2', to ensure high volume support for trades. The video promises to help traders become profitable and pass prop firm evaluations with this comprehensive approach.

Takeaways

  • 📈 The video introduces a machine learning trading indicator that aims to improve profitability and pass prop firm evaluations.
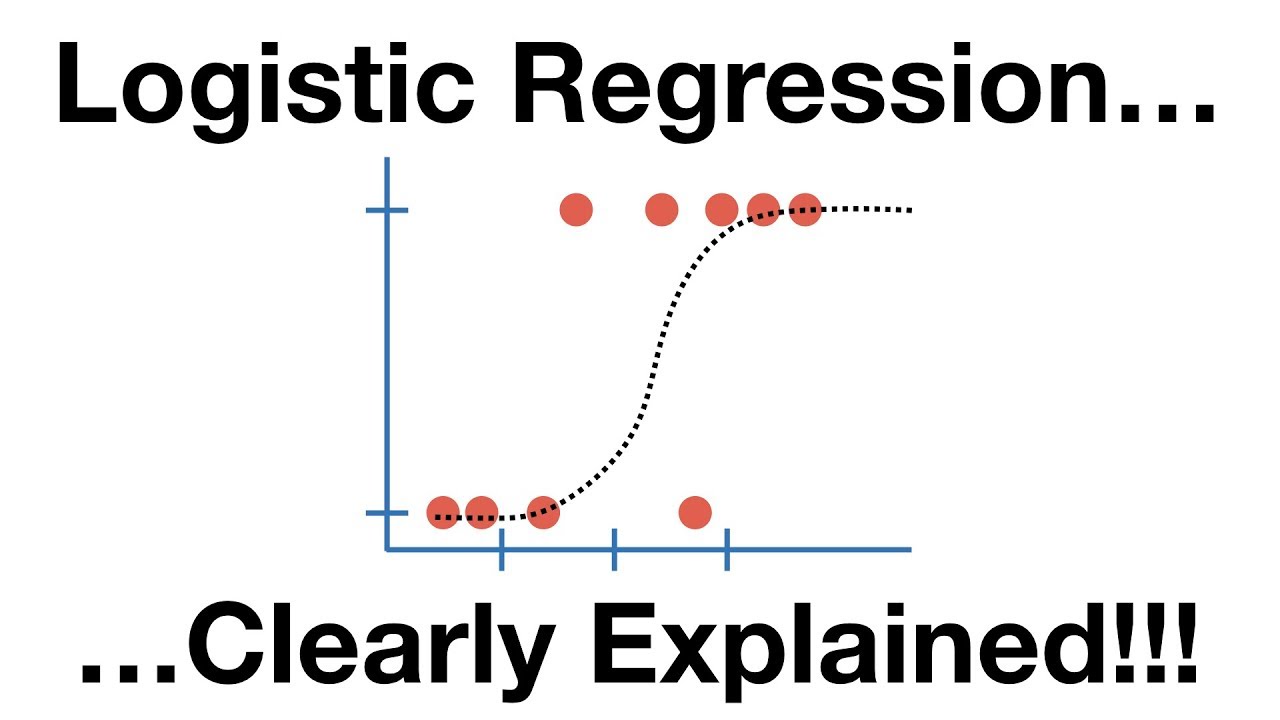
  • 🔍 The indicator uses multiple logistic regression, combining data from various indicators such as RSI, CCI, DMI, and Super Trend.
  • ⚙️ It employs machine learning and AI to predict market trends, volume, and money flow for optimal trading performance.
  • 📊 The indicator is best used on a 5-minute time frame for any 4X currency pair.
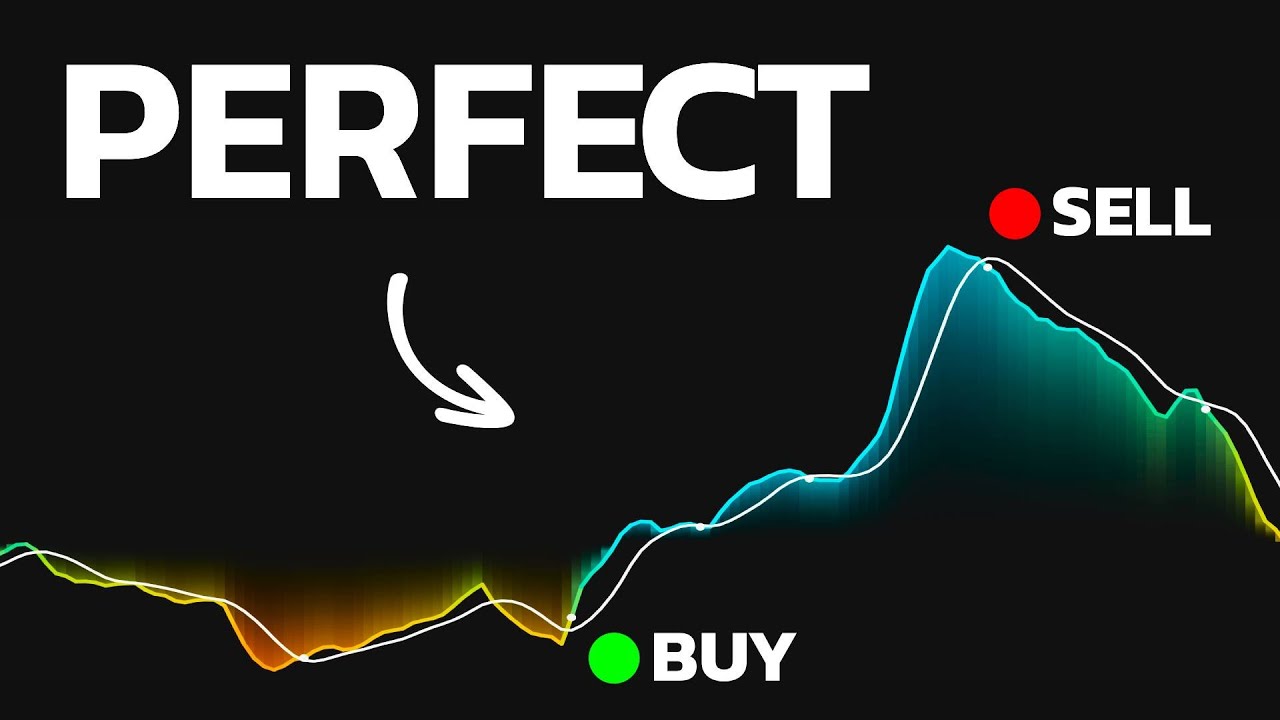
  • 📝 The indicator displays logistic regression values with numbers greater than 0.5 indicating positive signals and less than 0.5 indicating negative signals.
  • 🛑 To avoid false signals, especially in flat market conditions, the video suggests using a filter indicator for confirmation.
  • 🔄 The Andian Oscillator is recommended as a filter to pinpoint trade entries and confirm signals.
  • 💰 The strategy involves setting stop loss at the most recent swing low and taking profit at 1.5 times the risk.
  • ❌ Ignore signals when the Andian Oscillator's line is not above the orange line or confirmation does not occur within three candles.
  • 📊 An additional volume profile indicator, Wada ATA Explosion V2, is suggested to further filter trades and boost profitability.
  • 📈 Entry into a trade is confirmed when there is a high volume activity indicated by the green or red bar above the orange line in the Wada ATA indicator.
  • 👍 The video encourages viewers to subscribe and like for more trading strategies and tips.

Q & A

  • What is the main purpose of the video?

    -The video aims to introduce a machine learning trading indicator that can help viewers become profitable in trading and pass their prop firm evaluation.

  • Which indicator does the video recommend for trading on TradingView?

    -The video recommends using the 'Machine Learning Multiple Logistic Regression' indicator.

  • What other indicators does the 'Machine Learning Multiple Logistic Regression' indicator combine data from?

    -It combines data from indicators such as RSI, CCI, DMI, Super Trend, and others.

  • What is the suggested time frame for using this indicator?

    -The 5-minute time frame on any 4X pair is recommended for optimal performance.

  • What does the logistic regression line represent in the indicator?

    -The logistic regression line represents buy and sell signals, switching between green and red, with green representing buy signals and red representing sell signals.

  • What is the significance of the numbers above and below the price in the indicator?

    -The numbers represent logistic regression values, with values greater than 0.5 indicating positive signals and less than 0.5 indicating negative signals.

  • Which additional indicator is suggested to filter out false signals?

    -The 'Andian Oscillator' is suggested as an additional filter to confirm the right signals to take.

  • What is the recommended approach for setting stop loss and take profit in this strategy?

    -Set the stop loss at the most recent swing low and take profit at a level 1.5 times the risk.

  • What is the 'Wada ATA Explosion V2' indicator used for in this strategy?

    -The 'Wada ATA Explosion V2' indicator is used to confirm trade signals by checking for high volume activity.

  • How does the video suggest traders should handle signals without confirmation from the Andian Oscillator?

    -Traders should ignore signals that do not have crossing confirmation from the Andian Oscillator or that do not occur within three candles after the signals were generated.

  • What is the potential monthly income if a trader makes 1% on a $200,000 account each week?

    -A trader could potentially make between $7,000 to $8,000 each month.

  • What should a trader do if the Andian Oscillator's line is close to crossing the Orange Line at the time of the signal?

    -The trader can wait for the next three to five candles for the crossing to happen and then enter the trade if it occurs.

  • How does the volume profile indicator help in confirming trade signals?

    -The volume profile indicator helps by confirming high volume activity, which validates the trade signals and minimizes risks.

Outlines

00:00

🤖 Machine Learning Trading Strategy Introduction

This paragraph introduces a machine learning-based trading indicator for TradingView, designed to enhance profitability and assist in passing proprietary firm evaluations. The presenter encourages viewers to watch the entire video for trade examples and a bonus indicator reveal. The indicator combines various data from other indicators like RSI, CCI, DMI, and more, using AI to predict market trends. It is used on a 5-minute time frame for any 4X pair, with logistic regression values indicating the strength of signals. The video also mentions a premium confirmation indicator, Andian Oscillator, to filter out false signals and improve trade entry pinpointing. Additionally, viewers are invited to sign up for Fundy Trading, which offers a $200,000 trading account with minimal personal risk.

05:01

📈 Advanced Trading Strategy with Volume Profile

The second paragraph delves into the specifics of the trading strategy, explaining how to execute trades based on the machine learning indicator and Andian Oscillator signals. It emphasizes the importance of confirming signals with volume activity using the Wada ATA Explosion V2 indicator. The strategy involves entering trades when specific conditions are met, such as the green line crossing the orange line within three candles of a buy signal, and setting stop losses and take profits based on risk. The paragraph also discusses avoiding certain signals that lack confirmation or occur in clusters, and highlights the benefits of using volume profiling for minimizing risk and maximizing profitability. The video concludes by encouraging viewers to like the video and watch the next one, which promises to reveal a powerful trend-based indicator with multiple features for optimal trade entry signals.

Mindmap

Keywords

💡Machine Learning

Machine Learning is a subset of artificial intelligence that enables systems to learn from and make decisions based on data. In the context of the video, it is used to develop a trading indicator that can predict market trends by analyzing various data points. The script mentions that the 'machine learning multiple logistic regression indicator' combines data from different indicators to generate trading signals, showcasing the application of machine learning in financial analysis.

💡Trading View

Trading View is a web-based platform for traders and investors to analyze financial markets and build trading strategies. The script introduces a specific trading indicator available on Trading View, indicating its utility for traders to visualize and execute trades based on technical analysis. The platform is central to the video's demonstration of the trading strategy.

💡Indicator

In trading, an indicator is a tool that helps traders identify entry and exit points for trades by analyzing price action, volume, and other market data. The video script discusses several indicators, such as the 'machine learning multiple logistic regression indicator' and the 'Andian oscillator,' which are integral to the strategy being presented for generating trading signals.

💡Logistic Regression

Logistic regression is a statistical method for analyzing a dataset in which there are one or more independent variables that determine an outcome. In the video, the 'machine learning multiple logistic regression indicator' uses logistic regression values to generate buy and sell signals, with values greater than 0.5 indicating positive signals and less than 0.5 indicating negative signals.

💡RSI (Relative Strength Index)

RSI is a momentum oscillator that measures the speed and change of price movements to identify overbought or oversold conditions in the market. The script mentions RSI as one of the indicators combined in the 'machine learning multiple logistic regression indicator,' highlighting its role in assessing the strength of recent price movements.

💡CCI (Commodity Channel Index)

CCI is an oscillator that measures the difference between a commodity's or asset's current price and its average price over a certain period. It is used to identify cyclical trends. The video script includes CCI as part of the data inputs for the machine learning indicator, emphasizing its importance in detecting price deviations from historical averages.

💡DMI (Directional Movement Index)

DMI is a technical indicator that measures the strength of a price move in a security. It consists of three lines: +DI, -DI, and ADX, which help determine the presence of a trend and its strength. The script refers to DMI as one of the indicators contributing to the machine learning model, indicating its use in assessing market directionality.

💡Andian Oscillator

The Andian oscillator, mentioned in the script, is an indicator used to confirm trade entries by identifying when the oscillator's line crosses above or below a threshold line. It is used in conjunction with the machine learning indicator to filter out false signals and confirm valid trade entries, as illustrated when the script describes buying or selling based on the green or red line's position relative to the orange line.

💡Volume Profile

Volume profile is a plot of trading volume at specified price levels, providing a visual representation of the market's volume at various price points. The video script introduces 'Wada ATA explosion V2' as a volume profile indicator used to further validate trade signals by ensuring there is high volume activity supporting the trade, as shown when the script discusses confirming buy or sell signals with high volume bars above the orange line.

💡Prop Firm Evaluation

A prop firm, or proprietary trading firm, evaluates traders based on their ability to generate profits consistently. The script suggests that the presented trading strategy can help traders pass such evaluations by demonstrating profitability. The mention of making 1% on a $200,000 account each week to earn significant monthly profits is an example of the performance metrics that prop firms might consider.

💡Stop Loss

A stop loss is an order placed with a broker to sell a security when it reaches a certain price, aiming to limit an investor's loss on a position. In the video script, setting a stop loss at the most recent swing low is part of the risk management strategy when taking a trade, illustrating the importance of having an exit strategy to protect against significant losses.

💡Take Profit

Take profit is an order to sell a security when it reaches a certain price, aiming to lock in gains on a trade. The script describes setting a take profit level at 1.5 times the risk, which is a method of determining when to exit a profitable trade to secure earnings, showcasing a strategic approach to maximizing returns while managing risk.

Highlights

Introduction to a powerful machine learning trading view indicator for profitability and passing prop firm evaluations.

The indicator combines data from various indicators like RSI, CCI, DMI, and Super Trend to generate signals using machine learning and artificial intelligence.

Optimal performance is achieved by selecting the 5-minute time frame on any 4X pair.

Logistic regression values are used to determine buy and sell signals, with values above 0.5 being positive and below 0.5 negative.

Instructions on how to clear the chart by removing labels for better visualization.

The importance of avoiding false signals in flat market conditions by using a filter indicator.

Introduction of the Andian Oscillator as a premium confirmation indicator for pinpointing trade entries.

Criteria for a valid buy signal: Green triangle from the machine learning indicator and the green line of the Andian Oscillator above the orange line.

Setting stop loss at the most recent swing low and taking profit at 1.5 times the risk for trades.

Ignoring trades without crossing confirmation from the Andian Oscillator or within three candles after the signal.

The use of a volume profile to further confirm trade signals and its importance in passing prop firm evaluations.

Promotion of Fundy Trading for trading with up to $200,000 without risking your own capital.

Introduction of Wada ATA Explosion V2 as a secret volume indicator for further filtering trades and boosting profitability.

Instructions on confirming high volume activity with the Water ATA indicator for valid buy and sell signals.

Minimizing risks and entering the best trades by confirming signals with volume indicators.

The potential for passing prop firm evaluations swiftly with the presented strategy.

Encouragement to like the video and watch the next one for more powerful trend-based indicators.

Transcripts

play00:00

today I want to introduce you to a

play00:01

powerful machine learning trading view

play00:03

indicator that can help you become

play00:05

incredibly profitable and pass your prop

play00:07

firm evaluation just make sure you watch

play00:09

this video to the end because I will

play00:11

show you some trade examples using this

play00:13

strategy and I will also reveal a bonus

play00:15

indicator that will take this strategy

play00:16

to the next level excited hit that like

play00:19

And subscribe button and let's get

play00:21

started now in trading view head up to

play00:23

the indicator Tab and search for machine

play00:25

learning multiple logistic regression

play00:27

indicator and add it to your chart this

play00:30

amazing indicator combines data from

play00:32

indicators such as the RSI CCI DMI super

play00:36

Trend and some others to generate the

play00:38

best signals it does this by using

play00:40

machine learning and artificial

play00:41

intelligence to help Traders better

play00:43

predict market trends volume and money

play00:45

flow for Optimal Performance select the

play00:48

5minute time frame on any 4X pair when

play00:51

you look closely you see this indicator

play00:53

consists of some numbers the numbers

play00:55

above and below the price are logistic

play00:57

regression values values greater than

play01:00

0.5 are positive while those less than

play01:02

0.5 are negative let's remove them to

play01:05

make our chart clearer head to the style

play01:07

Tab and untick the labels box also you

play01:10

will see a line that switches between

play01:12

green and red this is the logistic

play01:14

regression line and within this line are

play01:16

Buy cell signals represented by green

play01:18

and red triangles we won't be entering

play01:21

all the signals as there are many false

play01:23

signals especially in flat market

play01:25

conditions So to avoid this we will be

play01:27

adding another excellent filter

play01:28

indicator that will confirm conf irm the

play01:30

right signals to take now just before we

play01:32

add this premium confirmation indicator

play01:34

to strengthen our strategy if you want

play01:36

to trade with $200,000 and keep up to

play01:38

95% of the profits without risking your

play01:41

own Capital sign up here at Fundy

play01:43

trading which is launching very soon so

play01:46

for confirmation go to the indicator tab

play01:48

search for andian oscillator and add it

play01:50

to your chart this is an excellent

play01:52

indicator that will pinpoint our trade

play01:54

entries now let's see how we can trade

play01:56

this strategy we buy when the machine

play01:58

learning indicator gives a green

play01:59

triangle and the green line of the

play02:01

andian oscillator is above the Orange

play02:03

Line we then set our stop loss at the

play02:05

most recent swing low and take profit at

play02:08

a level 1.5 times our

play02:10

risk conversely we sell when there is a

play02:12

red triangle signal that coincides with

play02:15

the red line of the andan oscillator

play02:17

above the Orange

play02:18

[Music]

play02:21

Line in a situation when we have our

play02:23

signal for a buy or sell but the red or

play02:26

green line is not above the Orange Line

play02:28

we ignore such trades if at the time of

play02:31

the signal the lines are close to

play02:32

crossing the Orange Line you can wait

play02:34

for the next three to five candles for

play02:36

such Crossing and then enter the trade

play02:37

if it

play02:42

happens so for this trade we buy because

play02:45

there is a Buy Signal from the machine

play02:46

learning indicator and the green line

play02:48

crosses the orange line of the andian

play02:50

oscillator within three candles set our

play02:53

stop loss at the recent swing low and

play02:54

take profit at 1.5 times our

play02:57

[Music]

play02:58

risk here we have a group of byell

play03:00

signals that we avoid because there are

play03:02

no Crossing confirmation from the andian

play03:04

oscillator nor do they happen within

play03:06

three candles after the signals were

play03:08

generated however the very next trade

play03:10

after this cluster is a valid Buy Signal

play03:12

because we have a Green Line crossing

play03:14

the orange line of the andian oscillator

play03:16

within three candles so we place our

play03:19

stop loss at the nearest swing low and

play03:21

take profit at a level at least 1.5

play03:23

times our

play03:25

risk now to take this strategy to the

play03:27

next level let's add one of my favorite

play03:29

indicators which is a volume profile

play03:31

that will confirm our trade signals

play03:33

essential to passing prop firm

play03:34

evaluations as just making 1% on a

play03:37

$200,000 account each week means you'll

play03:39

make7 to $8,000 each month if you want

play03:43

to trade on a $200,000 account without

play03:45

risking your own money in the process

play03:48

sign up at fund your trading with a link

play03:50

in the description now here is a secret

play03:52

volume indicator I use that will further

play03:54

filter the wrong trades and tremendously

play03:56

boost your profitability search for wada

play03:59

ATA explosion V2 and add it to your

play04:01

chart now head into the settings and in

play04:04

the style tab reduce the color zero

play04:06

opacity of both uptrend and downtrend to

play04:09

zero for our trades after we have been

play04:11

cleared to enter by the machine learning

play04:12

and andian oscillator we further filter

play04:14

it and check for high volume activity

play04:16

with the water atar indicator so for a

play04:19

Buy Signal we check if the green bar is

play04:21

above the orange line which means we

play04:22

have volume on our side and then we can

play04:24

enter the

play04:27

trade similarly for a set the Red Bar

play04:30

must be above the Orange

play04:33

[Music]

play04:33

[Applause]

play04:35

[Music]

play04:38

Line this way we can minimize our risks

play04:41

and enter the very best of Trades so for

play04:44

this trade the cell signal is valid as

play04:46

the red line of andian oscillator is

play04:48

above the orange line now we confirm if

play04:50

we have a high volume with water ATA the

play04:53

red bar is above the Orange Line showing

play04:55

there is a high volume to take the price

play04:56

down validating our signal you can see

play04:58

the trade went down for a reward of more

play05:01

than twice our risk if you stick to this

play05:03

approach you will be in a better

play05:04

position to swiftly pass your prop firm

play05:06

evaluation with this amazing strategy if

play05:09

you like this video do give it a thumbs

play05:11

up and you can watch this next video to

play05:13

see an incredibly powerful trend-based

play05:15

indicator with multiple built-in

play05:17

features that provide the best entry

play05:19

signals for trades good luck Traders

Rate This

5.0 / 5 (0 votes)

Etiquetas Relacionadas
Machine LearningTrading StrategyProfitabilityIndicator ToolLogistic RegressionMarket TrendsVolume ProfileRisk ManagementTechnical AnalysisFundy Trading
¿Necesitas un resumen en inglés?