Cara Analisis Regresi Linear Sederhana dengan Jamovi
Summary
TLDRThis video tutorial guides viewers through performing simple linear regression using Jamovi software. The analysis explores the relationship between 'ajun' (independent variable) and 'prestasi' (dependent variable). It covers setting up the regression model, interpreting key outputs like R-squared, coefficients, and significance tests. The video also explains how to check assumptions such as normality and heteroskedasticity, emphasizing residual analysis. The final model equation provides a method for predicting 'prestasi' based on 'ajun', helping viewers understand both the statistical process and the interpretation of results.
Takeaways
- 😀 The video demonstrates how to perform a simple linear regression analysis using the Jamovi software.
- 😀 The focus of the analysis is to determine whether motivation (Ajun) affects achievement (Prestasi).
- 😀 Jamovi is used to conduct the analysis, with 'Prestasi' as the dependent variable and 'Ajun' as the independent variable.
- 😀 The linear regression model in Jamovi outputs the R-squared value, which shows how much variation in achievement can be explained by motivation.
- 😀 The regression equation is: Prestasi = 0.275 * Ajun + 50.23, where 0.275 is the coefficient for motivation.
- 😀 The R-squared value of 0.39 indicates that motivation explains 39% of the variation in achievement.
- 😀 The p-value for the regression test is less than 0.001, indicating the results are statistically significant.
- 😀 Standardized estimates are used to compare the strength of predictors, and here it's used for the single predictor, 'Ajun'.
- 😀 Outlier detection is done through Cook’s Distance, but it is not crucial for this analysis as there is only one independent variable.
- 😀 Assumptions of normality and heteroskedasticity are tested to ensure the validity of the regression model, with results confirming that the assumptions are met.
- 😀 The Shapiro-Wilk test and visual tools, like residual plots, help confirm the normality of residuals, which is a key assumption in regression analysis.
Q & A
What is the main topic of the video?
-The video explains how to perform a simple linear regression analysis using the Jamovi software.
What is the dependent variable in the analysis?
-The dependent variable in the analysis is 'prestasi' (achievement).
What is the independent variable used in the regression analysis?
-The independent variable used in the regression analysis is 'Aegyo'.
Why is a simple linear regression chosen for this analysis?
-A simple linear regression is chosen because there is only one independent variable (Aegyo) in the analysis.
What does the R-squared value represent in the results?
-The R-squared value represents the proportion of the variation in the dependent variable (prestasi) that can be explained by the independent variable (Aegyo). In this case, 33.9% of the variation in achievement is explained by Aegyo.
What is the significance of the p-value in the analysis?
-The p-value is less than 0.001, indicating that the relationship between Aegyo and prestasi is statistically significant.
What does the regression equation derived in the video represent?
-The regression equation is 'prestasi = 0.275 * Aegyo + 50.23'. This equation predicts the achievement (prestasi) based on the value of Aegyo.
What are the assumptions tested in regression analysis?
-The assumptions tested in the regression analysis include normality and heteroskedasticity. The video also mentions that autocorrelation and collinearity are not relevant for this analysis.
How is the normality assumption tested in the video?
-Normality is tested using the Shapiro-Wilk test and Kolmogorov-Smirnov test. The results indicate that the normality assumption is met because the significance values are greater than 0.05.
What is the importance of the residuals in the regression analysis?
-The residuals represent the differences between the observed and predicted values. In regression analysis, the normality of residuals is crucial, and the residual plots should show no clear pattern to indicate that assumptions are met.
Outlines

Esta sección está disponible solo para usuarios con suscripción. Por favor, mejora tu plan para acceder a esta parte.
Mejorar ahoraMindmap

Esta sección está disponible solo para usuarios con suscripción. Por favor, mejora tu plan para acceder a esta parte.
Mejorar ahoraKeywords

Esta sección está disponible solo para usuarios con suscripción. Por favor, mejora tu plan para acceder a esta parte.
Mejorar ahoraHighlights

Esta sección está disponible solo para usuarios con suscripción. Por favor, mejora tu plan para acceder a esta parte.
Mejorar ahoraTranscripts

Esta sección está disponible solo para usuarios con suscripción. Por favor, mejora tu plan para acceder a esta parte.
Mejorar ahoraVer Más Videos Relacionados
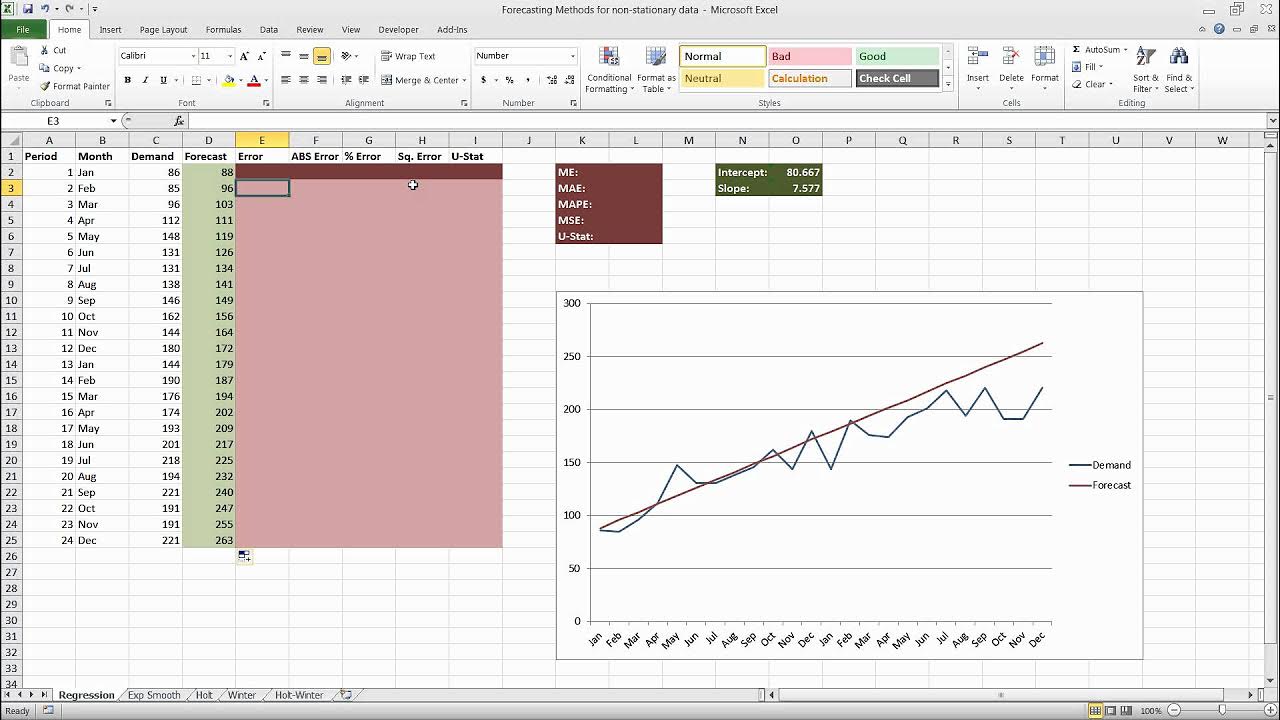
Forecasting in Excel Using Simple Linear Regression
Cara Analisis Regresi Berganda dengan JASP
Regression Intro - Practical Machine Learning Tutorial with Python p.2
Uji Asumsi Klasik SPSS Data Kuesioner beserta Analisis Regresi Linear Berganda
Data Mining 10 - Estimation (Linear Regression)
Metode Kuadrat Terkecil Hal 97-101 Bab 3 STATISTIK Kelas 11 SMA Kurikulum Merdeka
5.0 / 5 (0 votes)
