Cara mudah menggambarkan grafik fungsi kuadrat
Summary
TLDRThis video tutorial from the 'Matematika Hebat' channel demonstrates how to easily graph a quadratic function. The process includes finding the x-intercepts (roots) and y-intercept, calculating the vertex and axis of symmetry, and finally drawing the graph. The equation discussed is f(x) = x² + 2x - 3. The steps are simplified and explained thoroughly, making the process accessible to viewers, and the video aims to provide clear, easy-to-follow instructions for graphing quadratic functions in a visual and engaging way.
Takeaways
- 😀 The video introduces the topic of graphing quadratic functions.
- 😀 The host encourages viewers to like, subscribe, comment, and share the video to help support the channel.
- 😀 Step 1: The first task in graphing a quadratic function is to find the x-intercepts by solving the equation for when y = 0.
- 😀 The given quadratic function is f(x) = x^2 + 2x - 3, and its x-intercepts are found by factoring the equation to give x = -3 and x = 1.
- 😀 Step 2: The y-intercept is found by setting x = 0 in the equation. The y-intercept for the given function is (0, -3).
- 😀 Step 3: The vertex of the parabola is calculated using the formula for the x-coordinate of the vertex, which is -1 for this equation.
- 😀 The y-coordinate of the vertex is found by substituting x = -1 into the original quadratic equation, yielding the vertex as (-1, -4).
- 😀 Step 4: The graph is drawn by plotting the x-intercepts, y-intercept, and vertex, and then connecting the points to form a parabola.
- 😀 The axis of symmetry for the parabola is the vertical line passing through the vertex at x = -1.
- 😀 The video concludes with a reminder of the ease of graphing quadratic functions using the steps provided, and encourages viewers to apply the method for any quadratic equation.
Q & A
What is the main topic discussed in the video?
-The video discusses the process of graphing quadratic functions, providing a step-by-step guide to drawing the graph of the quadratic function f(x) = x^2 + 2x - 3.
What is the first step in graphing a quadratic function according to the video?
-The first step is to find the x-intercepts (or roots) of the quadratic function by solving the equation f(x) = 0.
How do you determine the x-intercepts of the quadratic function?
-The x-intercepts are found by factoring the quadratic equation. In this case, the equation x^2 + 2x - 3 = 0 factors into (x + 3)(x - 1) = 0, giving the solutions x = -3 and x = 1.
What is the next step after finding the x-intercepts?
-The next step is to find the y-intercept by substituting x = 0 into the quadratic equation and solving for y.
How do you find the y-intercept of the quadratic function?
-To find the y-intercept, substitute x = 0 into the equation f(x) = x^2 + 2x - 3. This results in f(0) = 0^2 + 2(0) - 3 = -3, so the y-intercept is (0, -3).
What is the next step after finding the x- and y-intercepts?
-After finding the x- and y-intercepts, the next step is to determine the vertex and axis of symmetry of the quadratic function.
How do you calculate the vertex of the quadratic function?
-The vertex can be found using the formula for the x-coordinate of the vertex: x = -b / (2a), where 'a' and 'b' are the coefficients from the quadratic equation. In this case, for f(x) = x^2 + 2x - 3, a = 1 and b = 2, so the x-coordinate of the vertex is x = -2 / (2*1) = -1.
How do you calculate the y-coordinate of the vertex?
-The y-coordinate of the vertex is found by substituting the x-coordinate of the vertex into the original quadratic equation. For x = -1, f(-1) = (-1)^2 + 2(-1) - 3 = -4. Thus, the vertex is (-1, -4).
What is the axis of symmetry of the quadratic function?
-The axis of symmetry is a vertical line passing through the x-coordinate of the vertex. In this case, the axis of symmetry is x = -1.
How do you graph the quadratic function?
-To graph the quadratic function, plot the x- and y-intercepts, the vertex, and the axis of symmetry. Then, connect these points with a smooth curve to form the parabola.
Outlines

Esta sección está disponible solo para usuarios con suscripción. Por favor, mejora tu plan para acceder a esta parte.
Mejorar ahoraMindmap

Esta sección está disponible solo para usuarios con suscripción. Por favor, mejora tu plan para acceder a esta parte.
Mejorar ahoraKeywords

Esta sección está disponible solo para usuarios con suscripción. Por favor, mejora tu plan para acceder a esta parte.
Mejorar ahoraHighlights

Esta sección está disponible solo para usuarios con suscripción. Por favor, mejora tu plan para acceder a esta parte.
Mejorar ahoraTranscripts

Esta sección está disponible solo para usuarios con suscripción. Por favor, mejora tu plan para acceder a esta parte.
Mejorar ahoraVer Más Videos Relacionados
HISTOGRAM
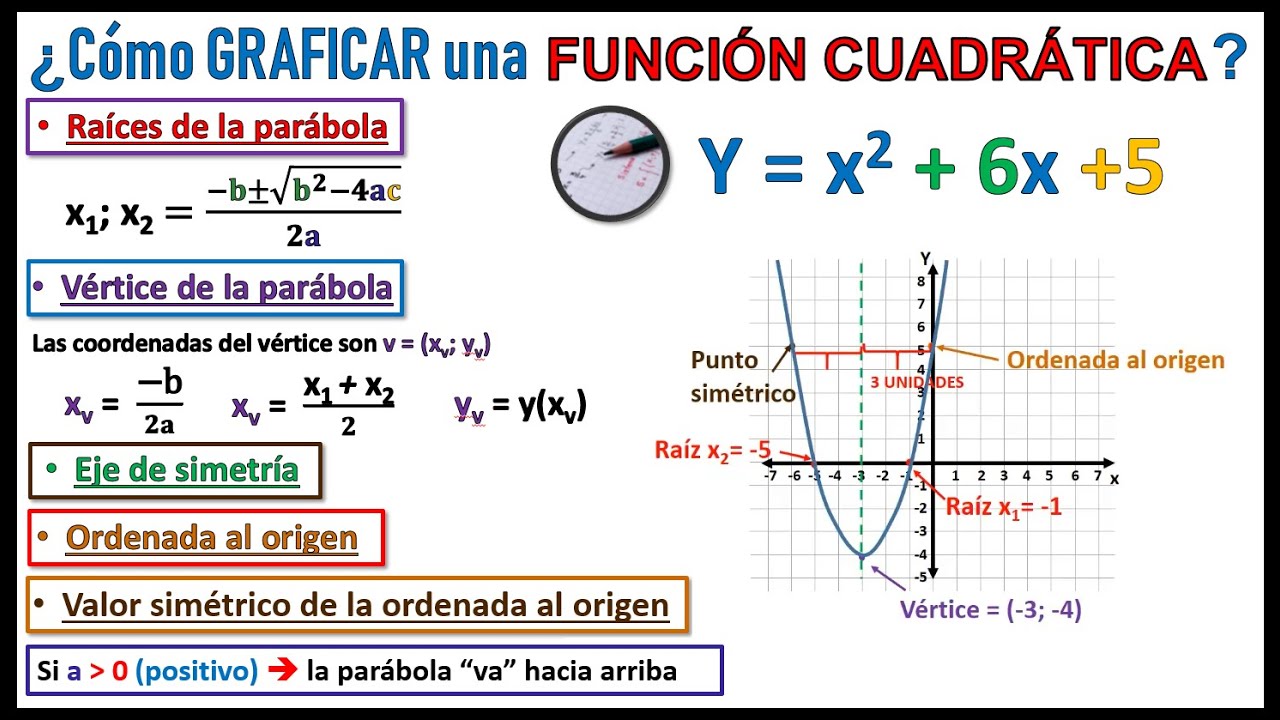
¿Cómo GRAFICAR una función CUADRÁTICA? RAÍCES, VÉRTICE, ORDENADA AL ORIGEN y MÁS

Menyusun Rumus Fungsi Kuadrat #fazanugas
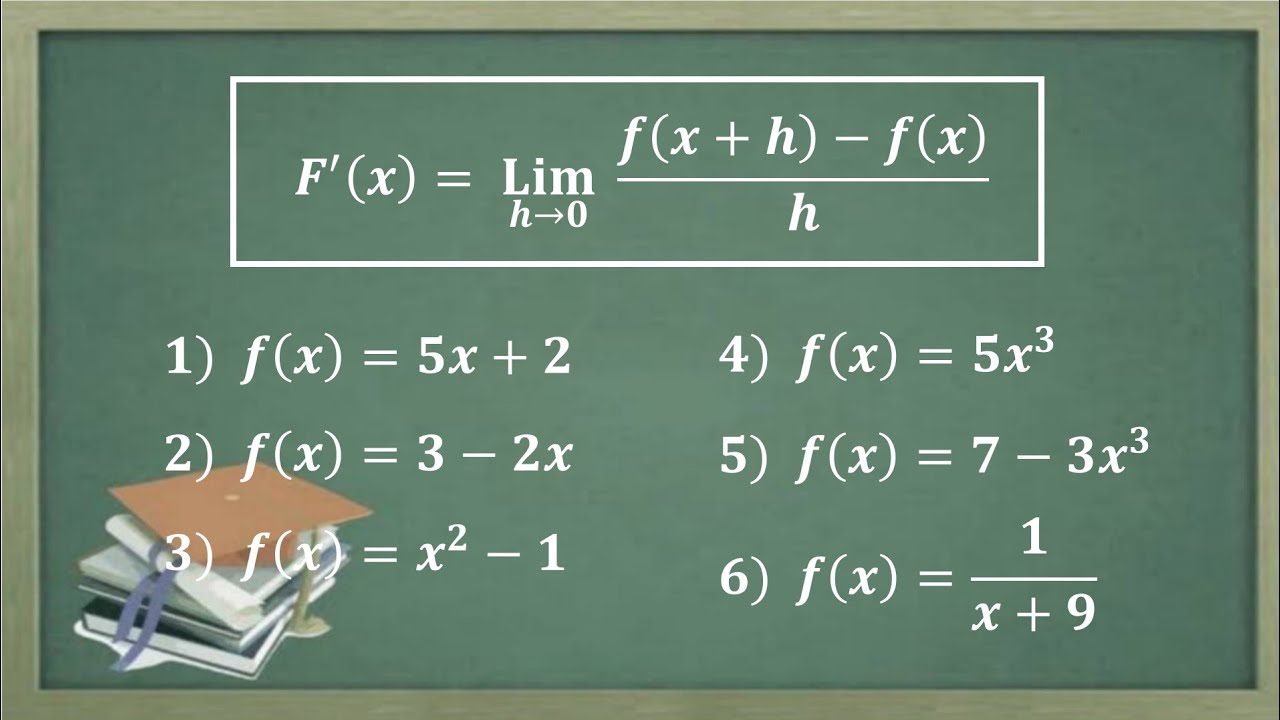
Turunan dengan menggunakan defnisi turunan Turunan menggunakan limit
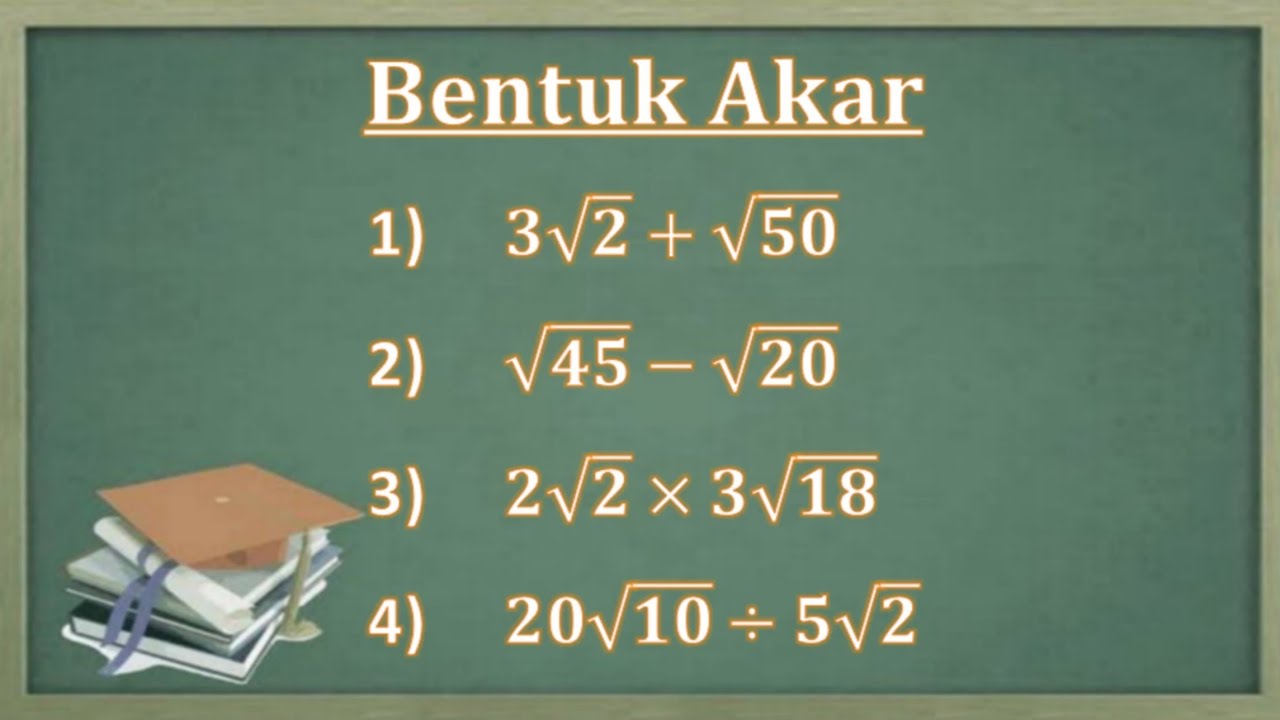
CARA MUDAH PENJUMLAHAN PENGURANGAN PERKALIAN DAN PEMBAGIAN BENTUK AKAR
Cara membuat grafik fungsi kuadrat
5.0 / 5 (0 votes)
