Grafik Garis Lurus
Summary
TLDRThis educational video explains how to graph linear equations, using a real-life analogy of fuel consumption in motorcycles. It introduces two methods for graphing a straight line: the first method involves using auxiliary points, and the second method utilizes the intersection points with the coordinate axes. The script demonstrates this by working through the equation 2x + y = 4, showing step-by-step how to find and plot key points on a Cartesian plane. Viewers are encouraged to practice these techniques to improve their skills in graphing linear equations.
Takeaways
- 😀 Fuel consumption in motorcycles increases as the distance traveled increases.
- 😀 The relationship between distance and fuel consumption can be modeled using a linear equation.
- 😀 A linear equation can be represented on a Cartesian coordinate system.
- 😀 The general form of a linear equation is y = MX + n or x + y = c.
- 😀 To graph a linear equation, you can use specific helper points.
- 😀 An example linear equation given is 2x + y = 4, which can be rewritten as y = 4 - 2x.
- 😀 To find helper points, you substitute different values of x into the equation to find the corresponding y values.
- 😀 For example, when x = -1, y = 6; when x = 0, y = 4; and when x = 3, y = 2.
- 😀 After finding the points, you plot them on the Cartesian coordinate system and draw a straight line through them.
- 😀 Another method for graphing is using the intercepts of the line with the coordinate axes.
- 😀 To find the x-intercept, set y = 0, and for the y-intercept, set x = 0, then plot these intercepts on the graph.
Q & A
What is the general form of a straight-line equation?
-The general form of a straight-line equation is either y = mx + n or x + y = c, where 'm' is the slope and 'n' is the y-intercept.
How is the relationship between the distance traveled and fuel consumption described in the video?
-The relationship between distance traveled and fuel consumption is modeled by a straight-line equation, which shows that as the distance increases, the fuel required increases proportionally.
What is the first method for plotting the graph of a straight-line equation?
-The first method involves using several points. By choosing values for x, substituting them into the equation to solve for y, and plotting the corresponding points on the graph.
How do you rewrite the equation 2x + y = 4 to make plotting easier?
-You rewrite the equation as y = 4 - 2x, which is in slope-intercept form, making it easier to plot the graph.
What x and y values were used to create the table for plotting the equation 2x + y = 4?
-The x-values chosen were -1, 0, and 1. The corresponding y-values were 6, 4, and 2, respectively.
What is the second method for plotting the graph of a straight-line equation?
-The second method involves finding the intercepts of the line with the x-axis and y-axis. You substitute values of 0 for x and y, respectively, to find the points where the line intersects the axes.
How do you find the x-intercept of the equation 2x + y = 4?
-To find the x-intercept, you set y = 0 and solve for x. Substituting y = 0 into the equation gives x = 2, so the x-intercept is at (2, 0).
How do you find the y-intercept of the equation 2x + y = 4?
-To find the y-intercept, you set x = 0 and solve for y. Substituting x = 0 into the equation gives y = 4, so the y-intercept is at (0, 4).
Why are intercepts useful when plotting the graph of a straight line?
-Intercepts are useful because they provide clear, easy-to-plot points that help you quickly draw the straight line on a graph, especially when you don't have a table of values.
What can be concluded from using both methods to plot a straight-line equation?
-Both methods—using points and using intercepts—will result in the same graph, confirming the accuracy of the plot. The choice of method depends on what information is available or preferred.
Outlines

Esta sección está disponible solo para usuarios con suscripción. Por favor, mejora tu plan para acceder a esta parte.
Mejorar ahoraMindmap

Esta sección está disponible solo para usuarios con suscripción. Por favor, mejora tu plan para acceder a esta parte.
Mejorar ahoraKeywords

Esta sección está disponible solo para usuarios con suscripción. Por favor, mejora tu plan para acceder a esta parte.
Mejorar ahoraHighlights

Esta sección está disponible solo para usuarios con suscripción. Por favor, mejora tu plan para acceder a esta parte.
Mejorar ahoraTranscripts

Esta sección está disponible solo para usuarios con suscripción. Por favor, mejora tu plan para acceder a esta parte.
Mejorar ahoraVer Más Videos Relacionados

1. MENGGAMBAR GRAFIK PERSAMAAN GARIS LURUS - PERSAMAAN GARIS LURUS - KELAS 8 SMP

Write and graph a linear function by examining a real-life scenario
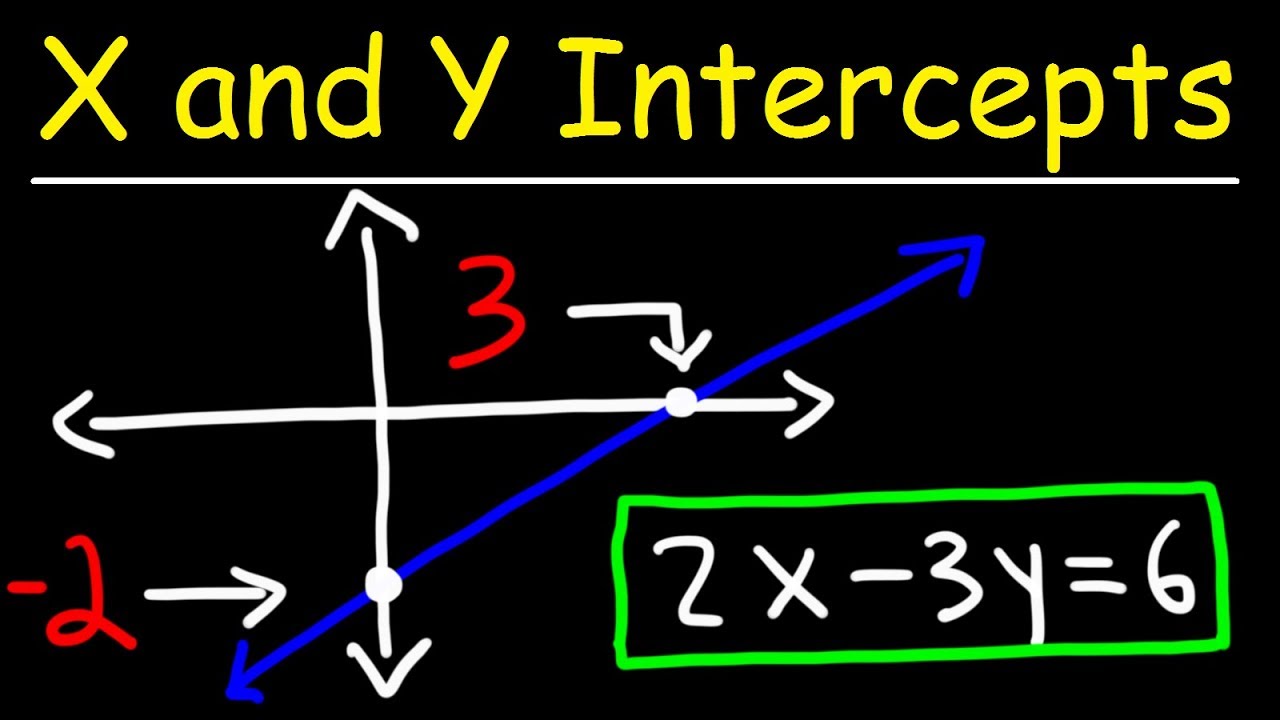
How To Find The X and Y Intercepts of a Line

2. PENGERTIAN GRADIEN - GRADIEN MELALUI 1 TITIK, 2 TITIK DAN DARI PERSAMAAN GARIS - PGL-KELAS 8 SMP

Persamaan Garis Lurus (1) | Menggambar Grafik PGL | Matematika Kelas 8
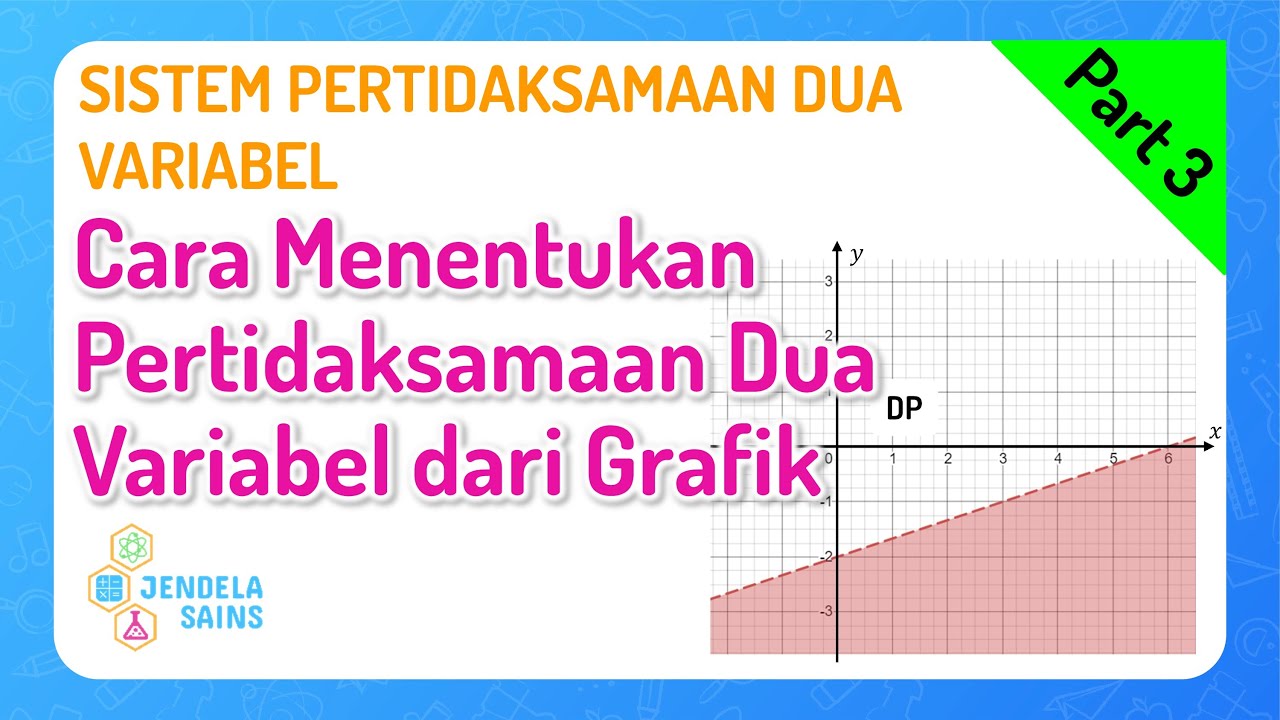
SPtDV • Part 3: Cara Menentukan Pertidaksamaan Dua Variabel dari Grafik Daerah Penyelesaian
5.0 / 5 (0 votes)
